


3 – Managing Fabrics
Displaying Fabric Information
59048-02 A 3-9
Q
3.3.2
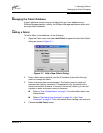
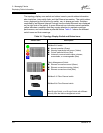
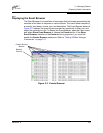
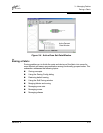
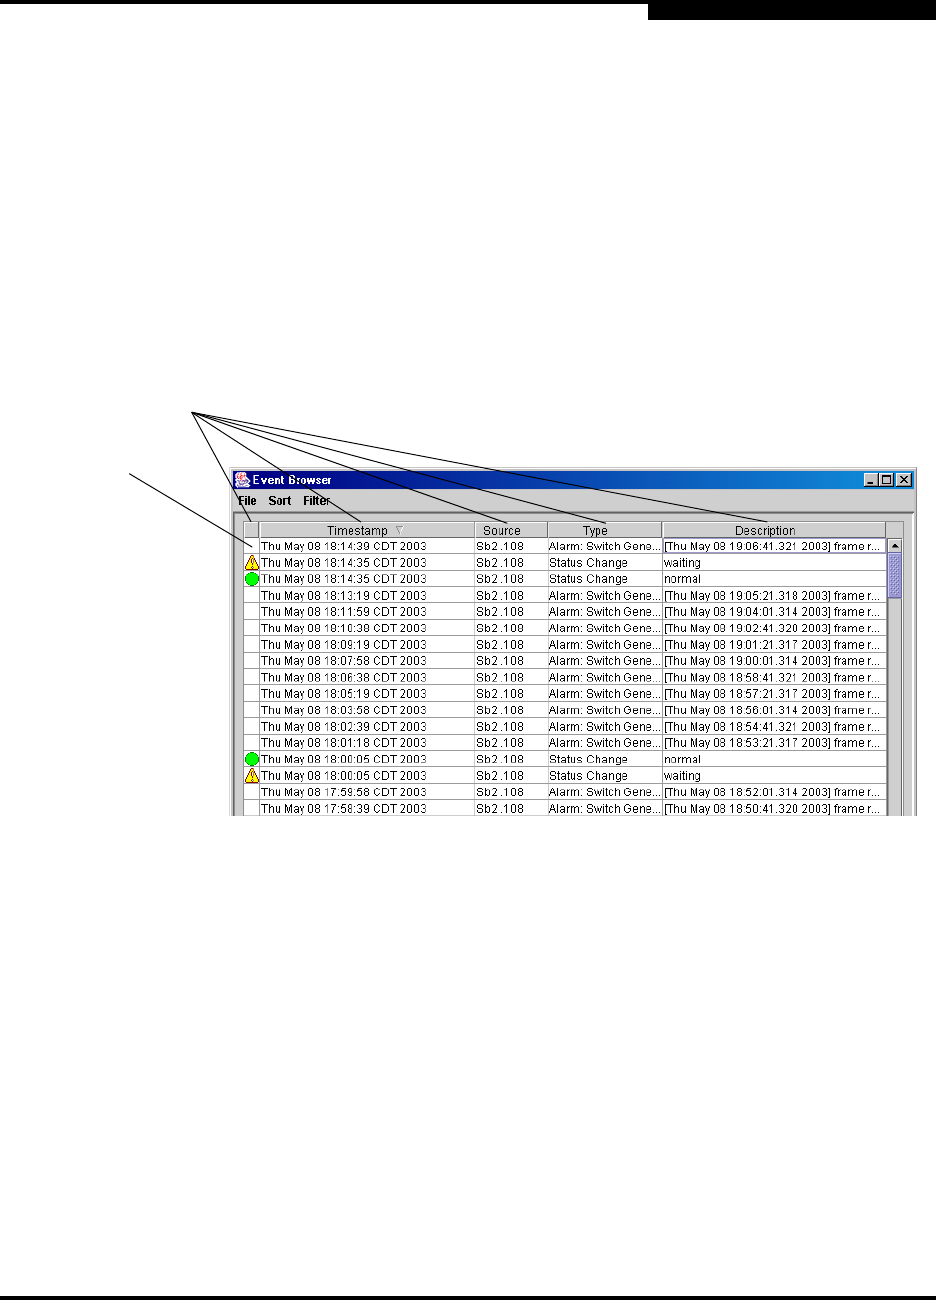
Displaying the Event Browser
The Event Browser is a compilation of messages that have been generated by the
switches in the fabric in response to various events. The event format consists of
a severity, time stamp, source, type, and description. The Event Browser shown in
Figure 3-2, displays the event log and provides an opportunity to filter, sort, and
export the contents to a file. To display the Event Browser, open the Fabric menu
and select Show Event Browser or choose the Events button. If the Show
Event Browser selection or the Events button is grayed-out, you must first
enable the Events Browser preference. Refer to ”Setting SANbox Manager
Preferences” on page 2-11.
Figure 3-2. Events Browser
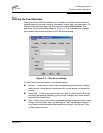
Column Sorting
Buttons
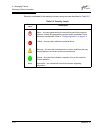
Severity
Column