


B – Graphing Port Performance
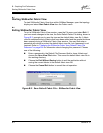
Displaying Graphs
B-6 59048-02 A
Q
B.7.1
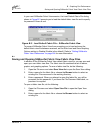
Arranging Graphs in the Display
To arrange and size graphs in the display, open the Window menu and select
Cascade, Tile, or Close All.
Cascade overlaps the graphs so that all graphs are at least partially visible.
Tile arranges the graphs in non-overlapping rows and columns.
Close All closes all graphs.
You can also click a graph on the Window menu to bring that graph to the front.
B.7.2
Customizing Graphs
You can customize the graph polling frequency, what is plotted in the graphs, and
the graph color scheme. To set the polling frequency for all graphs, open the
Graph menu and select Set Polling Frequency.... Enter an interval in seconds
(0–60) in the dialog box and choose the OK button.
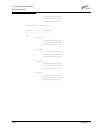
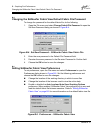
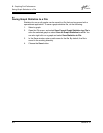
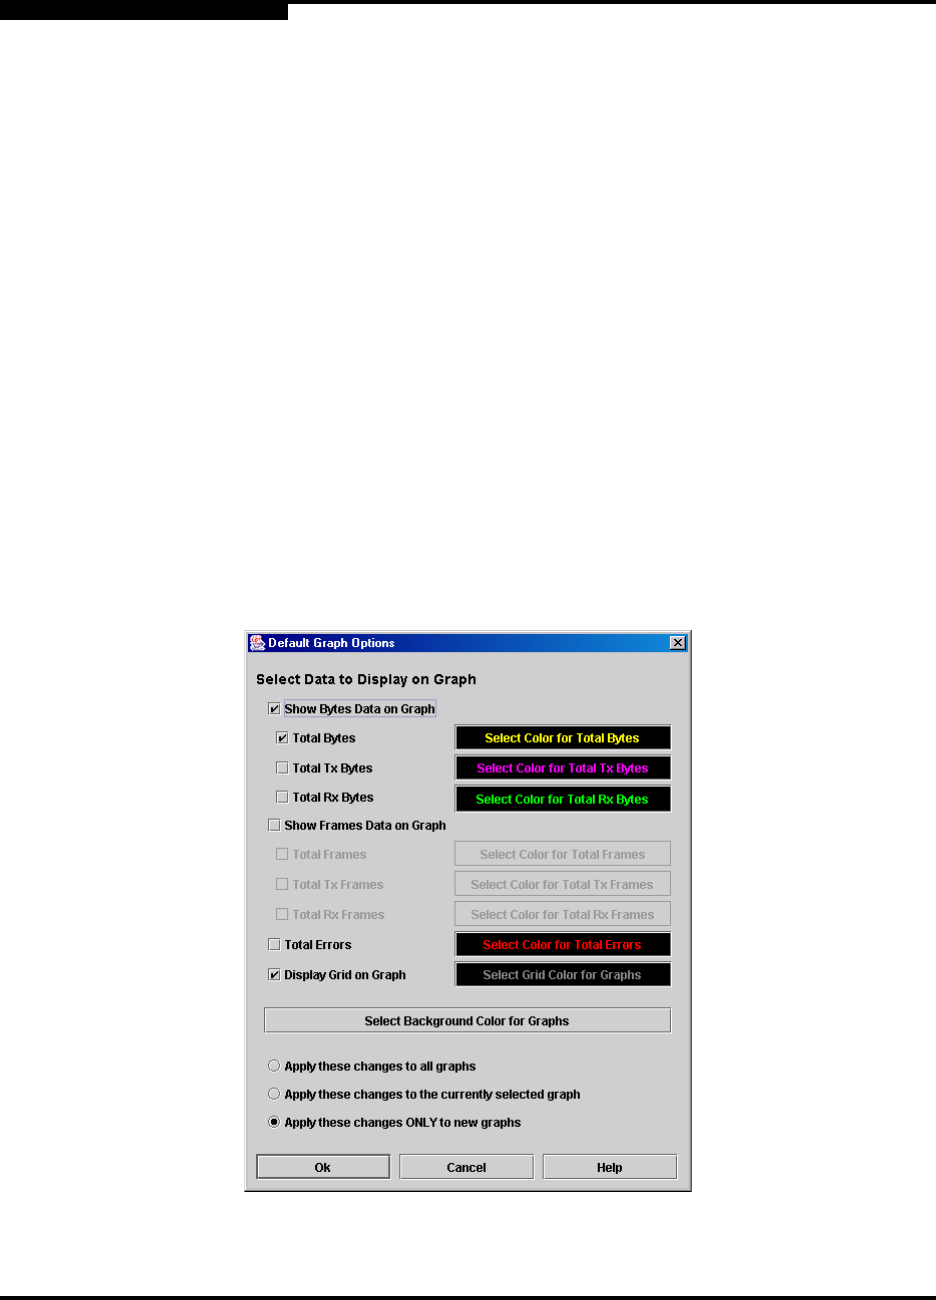
To choose what is to be plotted, open the Graph menu and select Modify Graph
Options.... You can also right click on a graph and select Change Graph
Options. This opens the Default Graph Options dialog shown in Figure B-6.
Figure B-6. Default Graph Options Dialog