


59048-02 A B-1
Appendix B
Graphing Port Performance
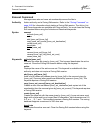
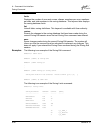
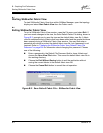
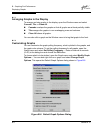
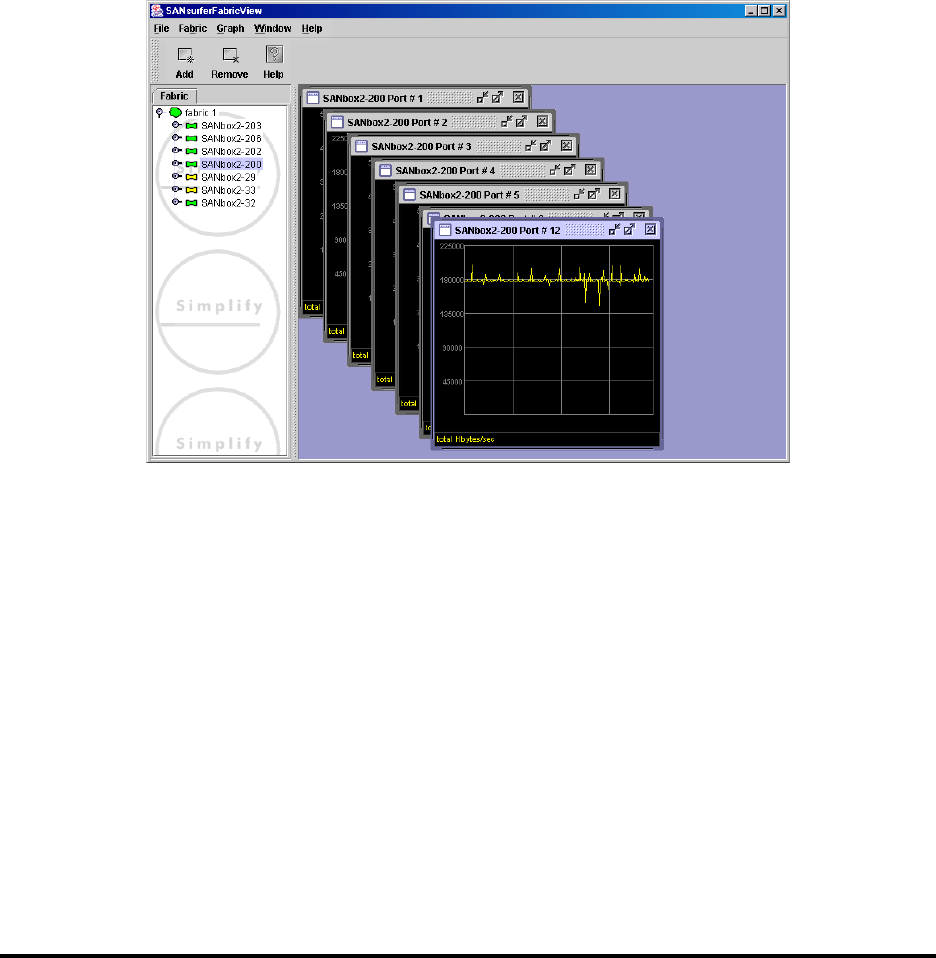
SANsurfer Fabric View is an optional application that displays port performance
using graphs. SANsurfer Fabric View plots data communication rates and total
errors for selected ports as shown in Figure B-1. When graphing data
communication rates, you can choose either frames/second or KB/second.
Figure B-1. Fabric View Graphs
This appendix describes how to do the following:
Start SANsurfer Fabric View
Exit SANsurfer Fabric View
Save and Open SANsurfer Fabric View Default Fabric View Files
Change the SANsurfer Fabric View Default Fabric File Password
Set SANsurfer Fabric View preferences
Set the polling frequency
Display graphs
Print graphs
Save graph statistics to a file