


Viewing Patient Data
8-14 Trends and Calculations
Trends and
Calculations
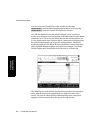
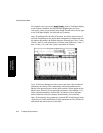
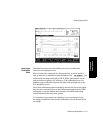
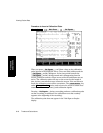
The values plotted are the stored averaged values of readings taken
every 12 seconds for a one-minute interval. Invalid data (such as a noisy
ECG) is not plotted on the graph. Instead, a gap will appear in the graph.
If you have configured your monitor for the OR, up to 4 hours of data at
12-second time intervals is available. In this case, the values are the
stored values for each 12-second reading.
Up to three graph channels are presented on the screen at once. The
graph will be blank when a listed parameter is not being monitored.
Up to five pre-configured screens can be displayed using the
softkey.
The
softkey allows you to adjust the scaling of the y-axis
of all graph channels at once. To change the scaling of individual graph
channels press the
softkey prior to . When
using a touchscreen select the label of the graph channel instead of
pressing select graph.
The report started with the softkey will use the current
scaling of the graphs displayed.
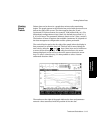
The number of points plotted for aperiodic parameters depends on the
number of values stored. Usually, every value is plotted. On CMS, up to
96 data points for each parameter can be stored for 24 hours (or for 48
hours if a memory extension is purchased and configured). On a V24 or
V26, up to 48 data points for each parameter (96 with specific
configurations) can be stored for 24 hours.
A “?” below a time label indicates that the time is questionable (e.g., the
time may have been altered since that time period). A “T” on the time
line denotes that some or all data has been transferred to the monitor
from a Philips M1235A Data Transfer Module.
The Events line below the graphs is for events marked manually (A, B,
C, D) and automatically (ST). Markers that are more than one-line thick
indicate multiple events for this time. See “Marking Events” on page 8-
16.
If a non-continuous measured parameter such as C.O is trended in
graphs, a star (*) appears beside each value.
Next Group
Change Scale
Select Graph
Change Scale
Print Graphs