Statistics 2Var app 227
Display the
equation
13. Return to the Symbolic view.
Y
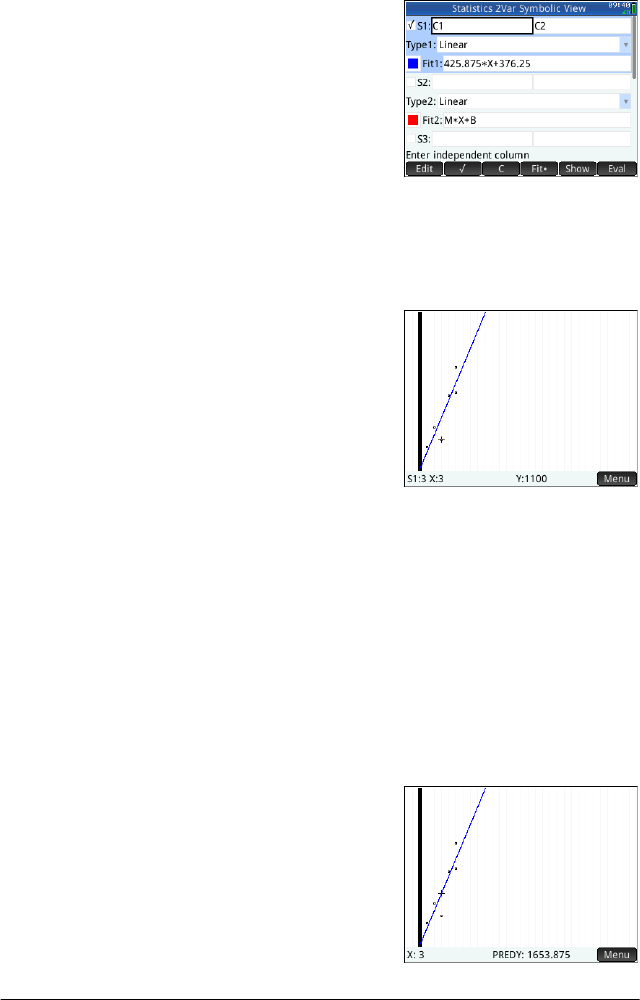
Note the expression
in the
Fit1 field. It
shows that the slope
(m) of the regression
line is 425.875 and
the y-intercept (b) is
376.25.
Predict values Let’s now predict the sales figure if advertising were to go
up to
6 minutes.
14. Return to the Plot
view:
P
The trace option is
active by default.
This option will move
the cursor from data
point to data point as you press
> or <. As you
move from data point to data point, the
corresponding x- and y-values appear at the bottom
of the screen. In this example, the x-axis represents
minutes of advertising and the y-axis represents sales.
However, there is no data point for 6 minutes. Thus
we cannot move the cursor to x = 6. Instead, we need
to predict what y will be when x = 6, based on the
data we do have. To do that, we need to trace the
regression curve, not the data points we have.
15. P r e s s
\ or = to set
the cursor to trace
the regression line
rather than the data
points.


