Polar app 279
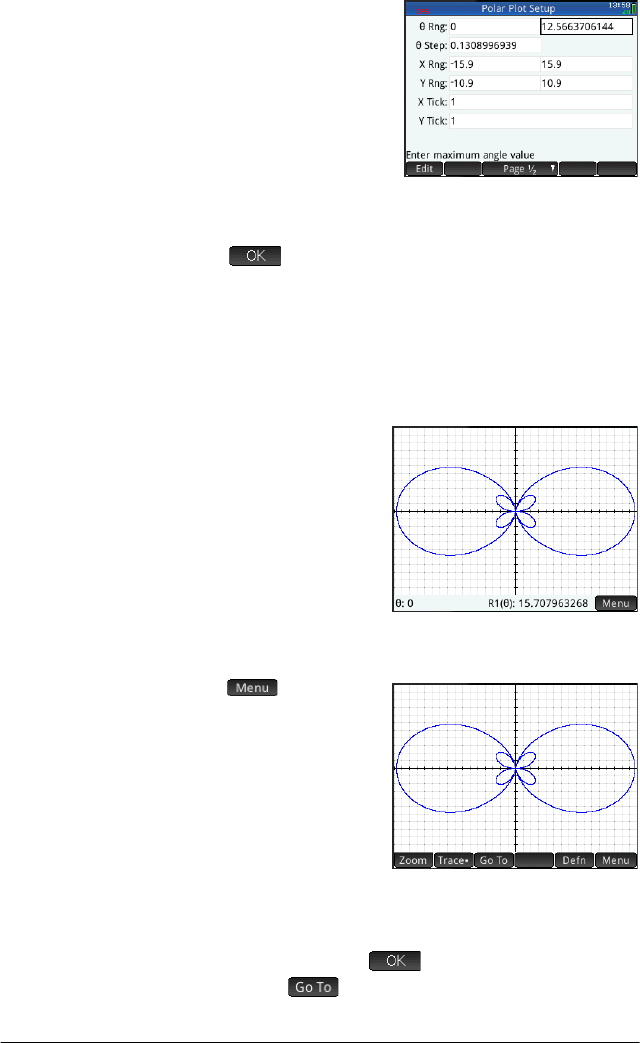
8. Set up the plot by
specifying
appropriate
graphing options. In
this example, set the
upper limit of the
range of the
independent
variable to 4:
Select the 2nd Rng field and enter 4
Sz
(
There are numerous ways of configuring the
appearance of Plot view. For more information, see
“Common operations in Plot Setup view” on
page 96.
Plot the
expression
9. Plot the expression:
P
Explore the
graph
10.Display the Plot view menu.
A number of
options appear to
help you explore
the graph, such as
zooming and
tracing. You can
also jump directly
to a particular value by entering that value. The Go
To screen appears with the number you typed on the
entry line. Just tap
to accept it. (You could also
tap the button and spwecify the target value.)


