


4 – Managing Switches
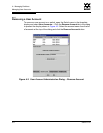
Displaying Switch Information
4-12 59022-11 A
0
4.2.3
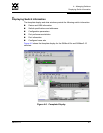
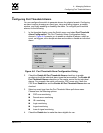
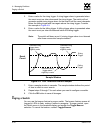
Port Statistics Data Window
The Port Statistics data window displays port performance data for the selected
ports. To open the Port Statistics data window, click the Port Stats tab below the
data window in the faceplate display. Refer to Table 5-5 for a description of the
Port Statistics data window entries.
The Statistics pull-down menu is available on the Port Statistics data window, and
provides different ways to view detailed port information. Click the down arrow to
open the pull-down menu. Open the pull-down menu and select Absolute to view
the total count of statistics since the last switch reset. Select Rate to view the
number of statistics counted per second over the polling period. Select Baseline
to view the total count of statistics since the last time the baseline was set. Click
the Clear Baseline button to set the current baseline.
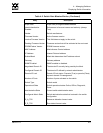
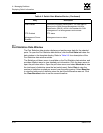
CIM Enabled Common Information Model status. The CIM agent is
based on the SNIA Storage Management Initiative
Specification (SMI-S), which is the standard for SAN
management in a heterogeneous environment.
FTP Enabled FTP status
Management Server
Enabled
Management server status.
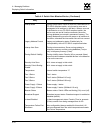
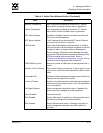
Table 4-2. Switch Data Window Entries (Continued)
Entry Description