


5 – Managing Ports
Graphing Port Performance
5-18 59022-11 A
0
5.6
Graphing Port Performance
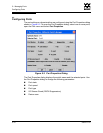
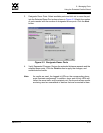
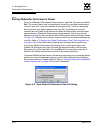
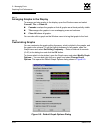
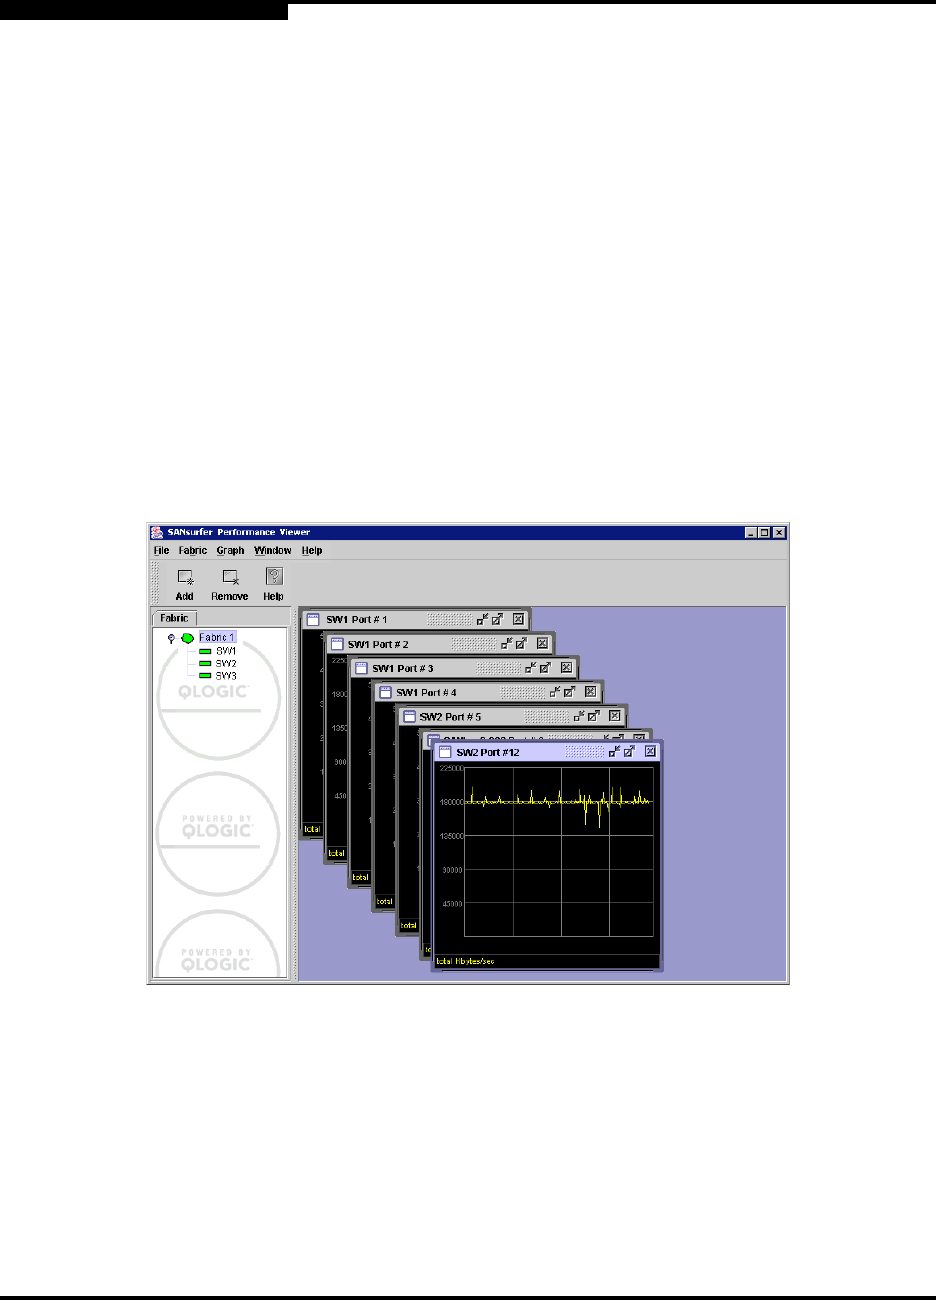
SANsurfer Performance Viewer application displays port performance using
graphs. SANsurfer Performance Viewer plots data communication rates and total
errors for selected ports as shown in Figure 5-5. When graphing data
communication rates, you can choose either frames/second or KB/second.
On Solaris platforms, if you launch the SANsurfer Performance Viewer application
from the SANsurfer Switch Manager application and SANsurfer Performance
Viewer can not connect to the fabric, (for example, if you have reached the
maximum number of SANsurfer Switch Manager sessions on the entry switch),
then SANsurfer Performance Viewer opens with a blue fabric icon displayed in the
fabric tree.
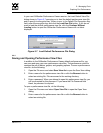
Fabric status is displayed in text format after the fabric name in the fabric tree. The
color of the icon indicates the current connection status as normal (green),
warning (yellow), critical (red), or unmanageable (blue).
Figure 5-5. Fabric View Graphs