


2 – Using SANsurfer Switch Manager
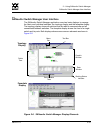
SANsurfer Switch Manager User Interface
59022-11 A 2-23
0
2.11.3
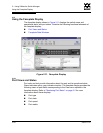
Fabric Tree
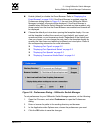
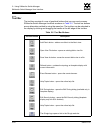
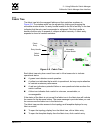
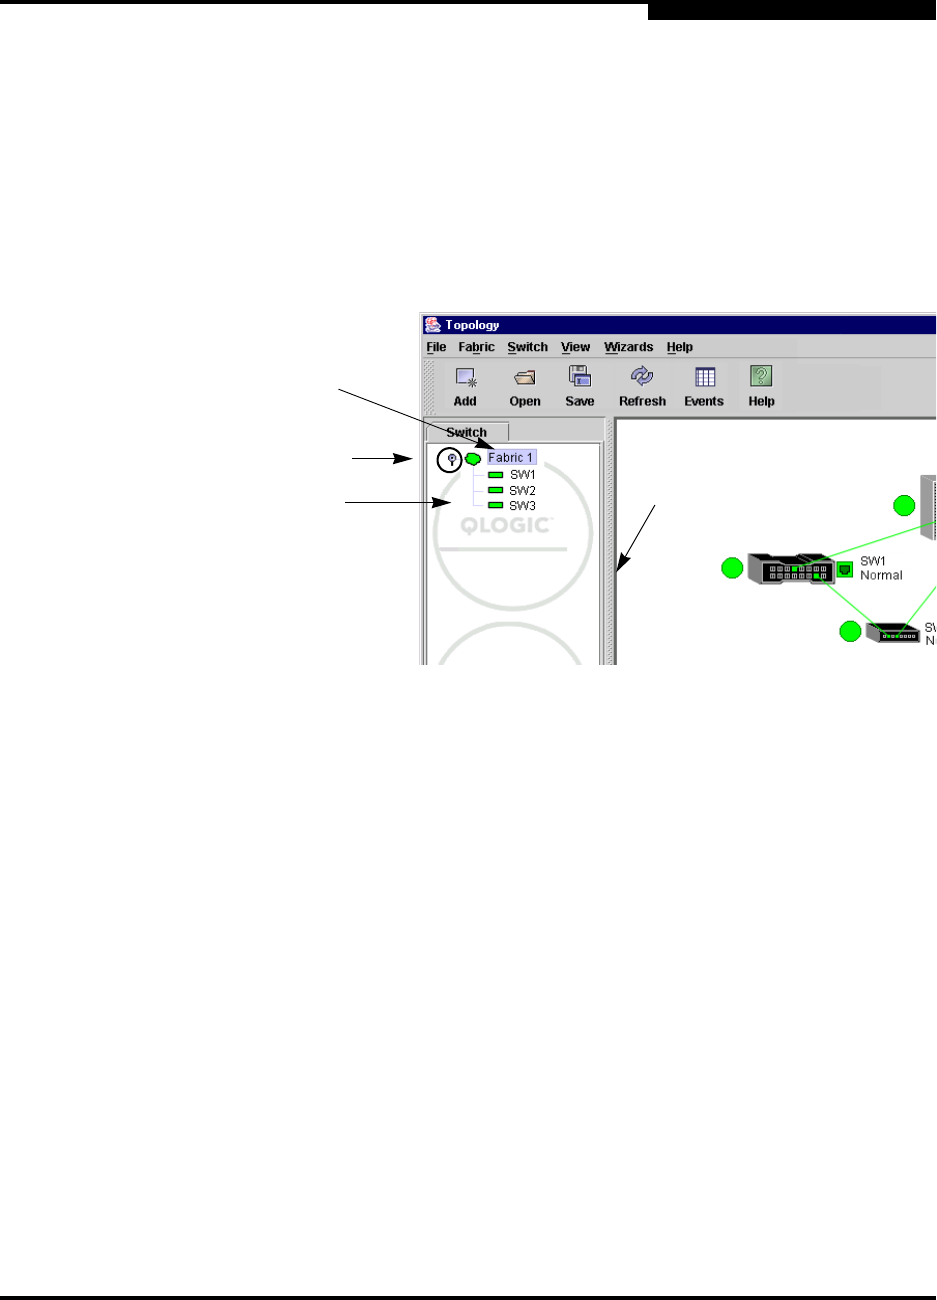
The fabric tree lists the managed fabrics and their switches as shown in
Figure 2-9. The window width can be adjusted by clicking and dragging the
moveable window border. An entry handle located to the left of an entry in the tree
indicates that the entry can be expanded or collapsed. Click this handle or
double-click the entry to expand or collapse a fabric tree entry. A fabric entry
expands to show its member switches.
Figure 2-9. Fabric Tree
Each fabric tree entry has a small icon next to it that uses color to indicate
operational status.
A green icon indicates normal operation.
A yellow icon indicates that a switch is operational, but may require attention
to maintain maximum performance.
A red icon indicates a potential failure or non-operational state as when the
switch is offline.
A blue icon indicates that a switch is unknown, unreachable, or
unmanageable.
If the status of the fabric is not normal, the fabric icon in the fabric tree will indicate
the reason for the abnormal status. The same message is provided when you rest
the mouse over the fabric icon in the fabric tree.
The fabric tree provides access to the topology and faceplate displays for any
fabric or switch.
To open the topology display from the fabric tree, click a fabric entry.
To open the faceplate display from the fabric tree, click a switch entry.
Switch
Entries
Moveable
Window Border
Entry Handle
Fabric
Entry