Overview 6-29
6
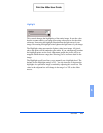
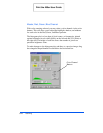
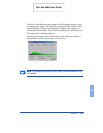
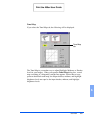
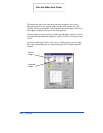
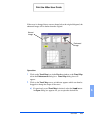
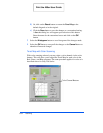
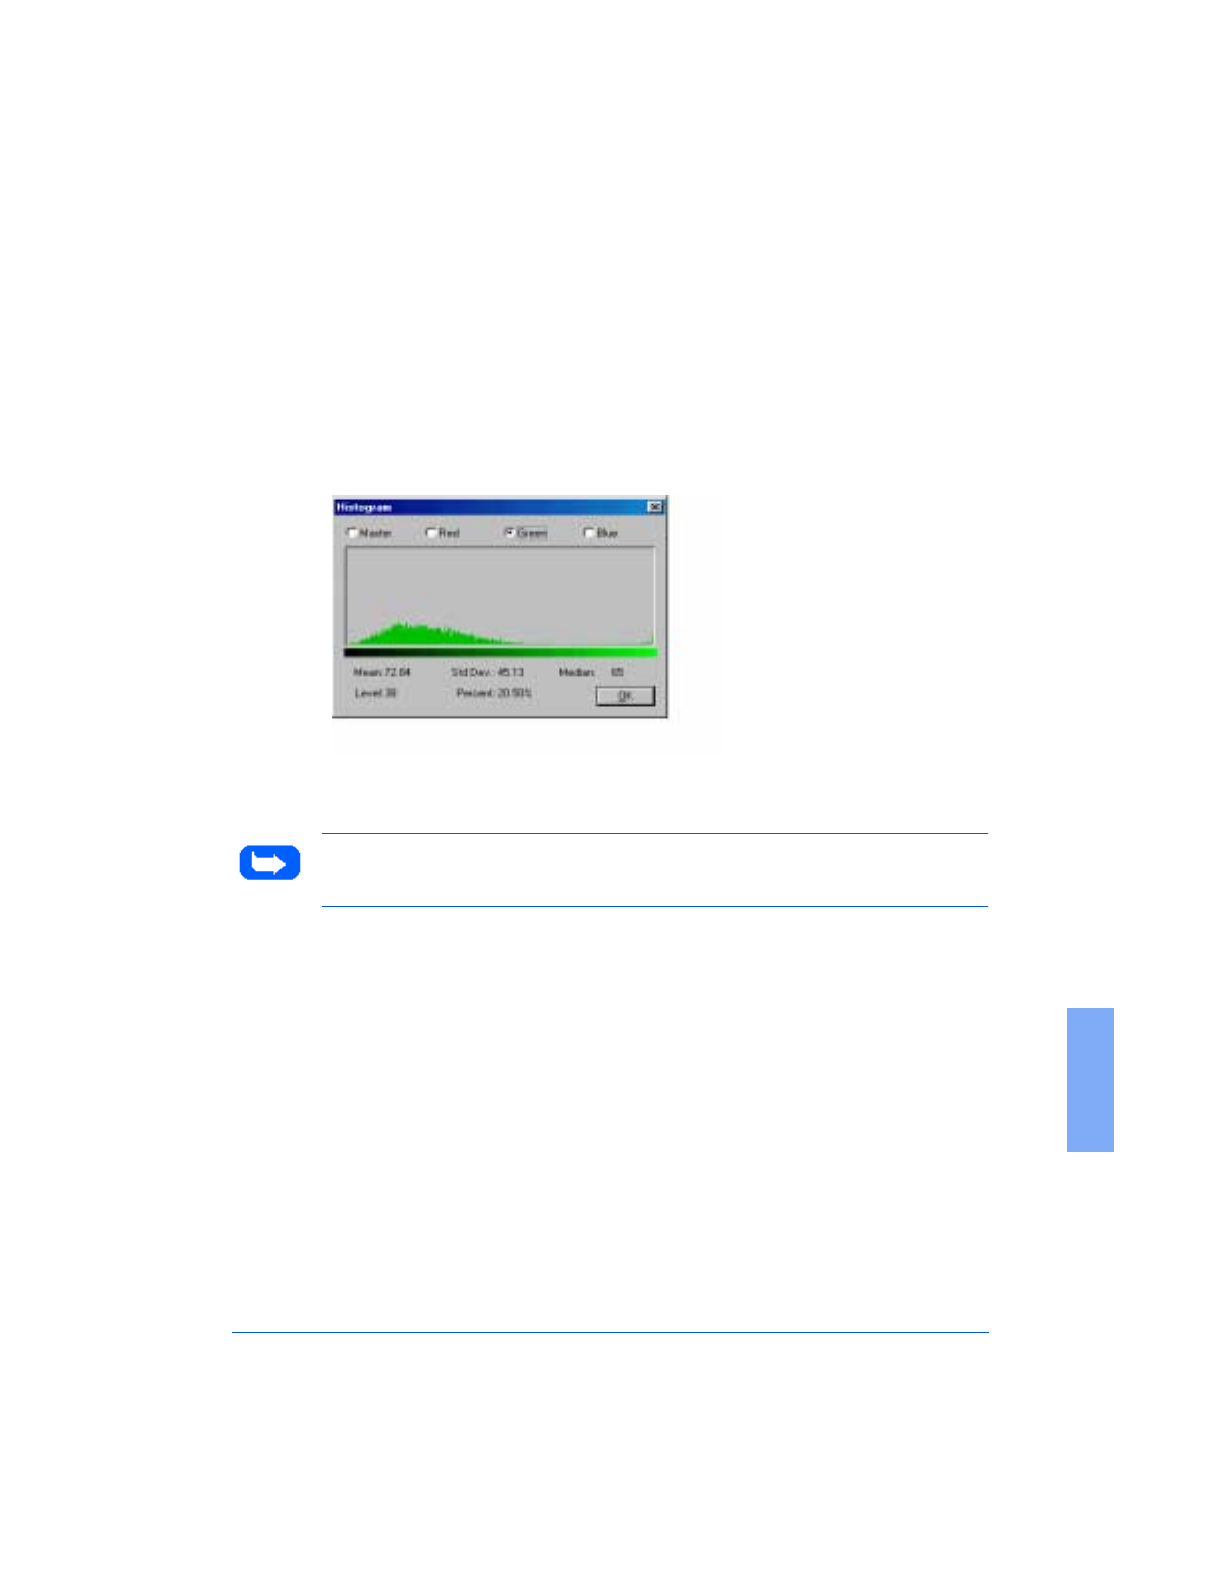
The effect of the Histogram plot changes in the Histogram dialog box may
be restricted to a single color channel by selecting the Red, Green, or Blue
channel buttons. Changes may be applied to all three color channels by
selecting the Master button. Color saturation information at indicated levels
will appear above the Histogram plot.
Clicking the Histogram button at the bottom of the dialog box displays a
histogram for the entire preview area, with statistics.
Note:
For grayscale scanning, the Red, Green, and Blue buttons will not
be available.
Print the 480cx User Guide


