


2-30 SPARC Enterprise M8000/M9000 Servers Service Manual • June 2010
Each error message logged by the predictive self-healing architecture has a code
associated with it as well as a web address that can be followed to get the most
up-to-date course of action for dealing with that error.
Refer to the Solaris OS documentation for more information on predictive
self-healing.
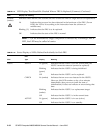
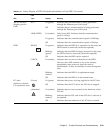
2.7 LED Error Display
This section explains the LEDs of each FRU that are to be checked when the relevant
FRU is replaced. Each LED can be checked after the door of a cabinet is opened.
Whether the state of the entire system is normal can be learned by checking the
operator panel (outside). When an error occurs in an individual hardware
component in the system, the LEDs of the FRU containing the hardware component
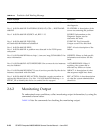
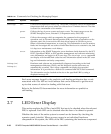
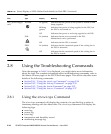
TABLE 2-10 Commands for Checking the Messaging Output
Command Operand Description
showlogs env Collects the temperature history log. The SPARC Enterprise server environmental
temperature data and power status are collected at a 10-minute interval. The data
is stored for a maximum of six months.
power Collects the log of power events and reset events. The target range covers the
SPARC Enterprise server, External I/O Expansion units, and UPSs.
event Collects the message which accompanies the command or the progress of
operation such as Dynamic Reconfiguration (DR), the status of operation on the
operator panel, the event such as the shut down request to OS due to power
failure or abnormal temperature, as event log. This information is used to analyze
faults and investigate the use status of individual devices at a customer's site, and
it is kept as a maintenance work history.
error Information on the SPARC Enterprise server hardware faults detected by the SCF,
POST/OpenBoot PROM, or ESF machine management and software monitoring
error information are logged as SCF error logs. The showlogs error command
can display with hexadecimal codes the error information stored in the SCF error
log and information on faulty components.
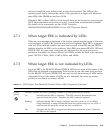
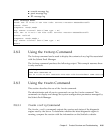
fmdump(1M)
fmdump(8)
Hardware and software are automatically diagnosed according to the fault
management architecture (FMA), and the diagnosis results and errors are
automatically recorded. The fmdump command can display the recorded
information. It is provided as a Solaris OS command and XSCF Shell command.
The information can be checked at the site at the specified URL by using a
displayed message ID.