


Section 4 – Functional Description
Page 34 09/11/2008 REV 0.99
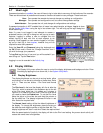
screen
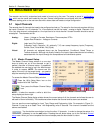
To draw on the screen, select the pen color as detailed above then, using the stylus, draw on the screen. Add
any text in the text box and place it on the screen using the place text icon as detailed above. This allows the
user to annotate clearly and precisely on the screen (see Figure 4-12.3 above) and save the picture
accordingly. An indication on the live trend indicates that a bitmap has been saved.
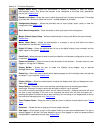
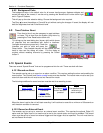
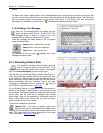
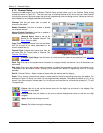
4.12.2 Adding a Text Message
Enter the Text Message Editor by tapping the icon
shown on the Annotate Screen - Figure 4-12.2. The
Text Message Editor is shown in Figure 4-12.4. Any
message can be entered in the text box as shown.
Once the message has been entered it can be placed
using the Attach button.
Attach button - embed text in the file.
Cancel button - abort the operation.
Clear button – clear current text.
An indication on the live trend indicates that a text
message has been saved.
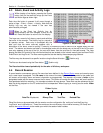
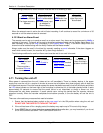
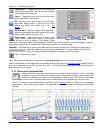
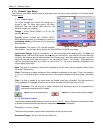
4.13 Browsing Historic Data
It is possible to browse through historic data that
may no longer be visible on the live trend. To do
this you need to tap the browse button (left) on the bottom
right of the live trend display as shown on the right.
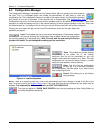
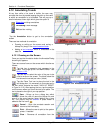
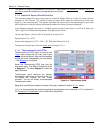
This will bring up the Browse Display window (See Figure 4-
13.2), which essentially freezes the current display (live data
is still updating in the background) and retrieves data from a
buffer holding the historic data through the time the browse
button was tapped. Note the “envelope” icon on the trend
indicating an embedded memo or bitmap file. Tap this
icon ONCE to view the contents – see below.
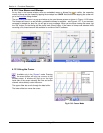
On the Browse Display it is possible to limit the number of
traces on the display or add markers to easily identify points
on the traces. The Browse Display will open and show the last
current data. Use the slider bar to navigate back through
historic data. Data can be expanded or contracted using the
Zoom % drop down menu and the user can jump to memos,
specific times and max or min values.
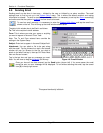
The controls available are as follows:
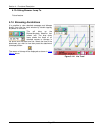
Markers On – The trace is actually made up of
distinct points with an interpolated line between them.
Tapping this icon will place markers on the actual points on the
trace. This helps identify the actual data points on the trend.
This can be seen in Figure 4-13.4 below.
Figure 4-13.1 Live Trend
Figure 4-13.2 Browse Display
Figure 4-12.4 Text Message Editor