


Section 4 – Functional Description
Page 35 09/11/2008 REV 0.99
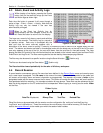
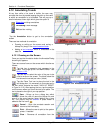
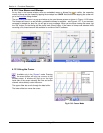
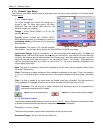
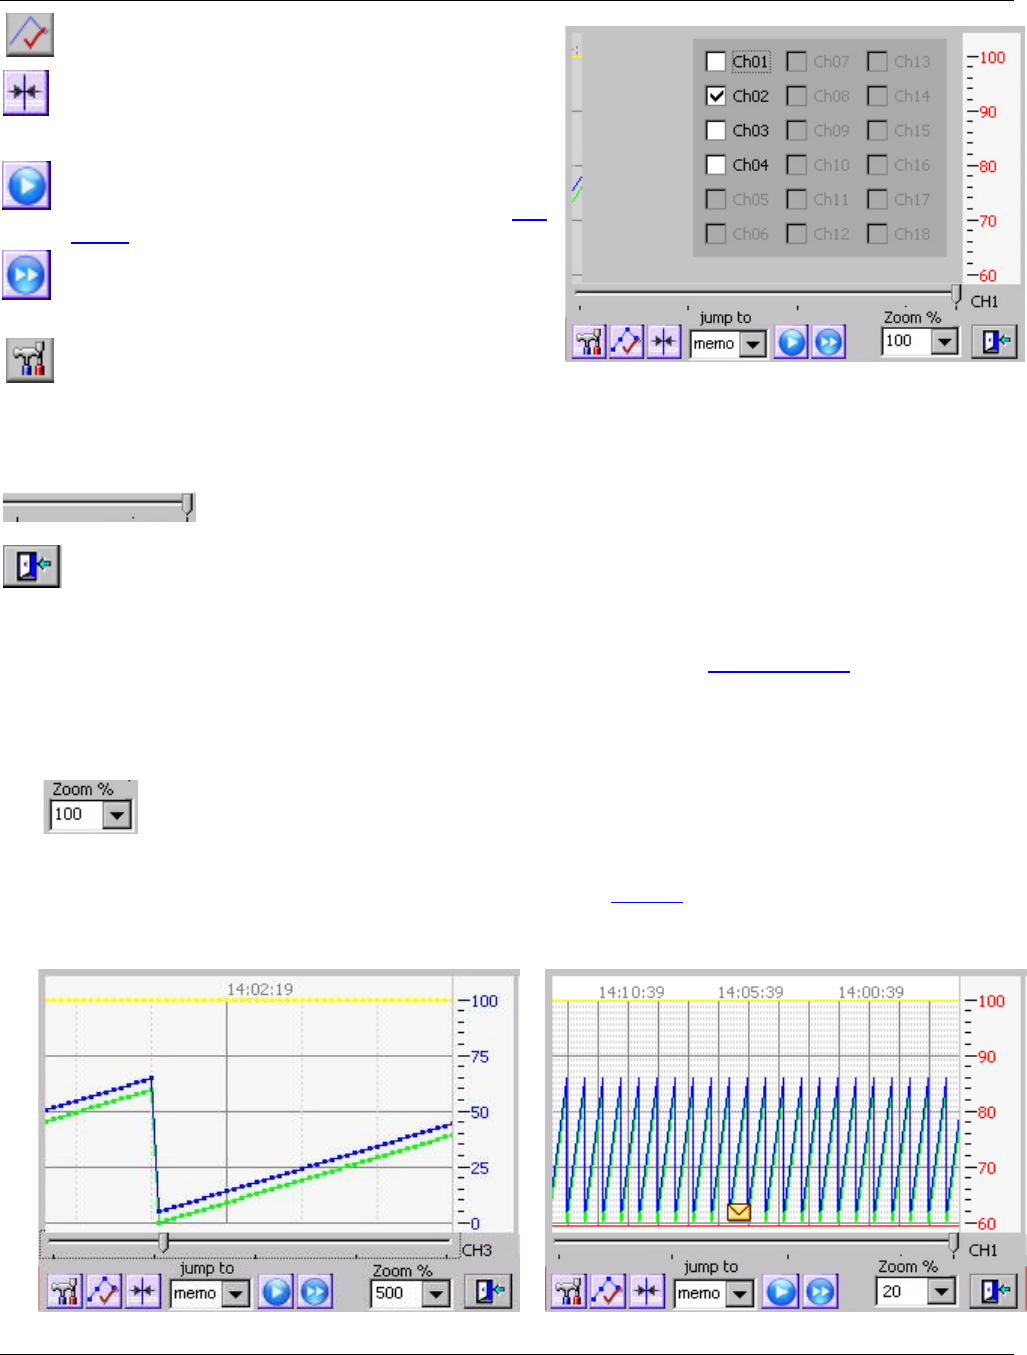
Figure 4-13.4 Zoom with point markers
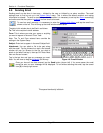
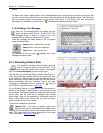
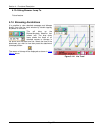
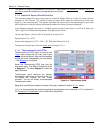
Figure 4-13.5 Compress no point markers.
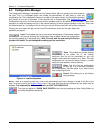
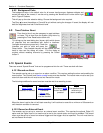
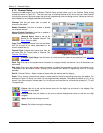
Figure 4-13.3 Trace Setup
Markers Off – Tapping this icon will remove the
markers from the traces. This icon will only be visible
if the markers are currently on.
Cursor – Tapping this icon turns on the cursor which
allows unique identification of the points.
Go – Proceed to the (next) instance of the „jump to”
drop down dialog (memo in Figure 4-13.3). Jump
options are memo, time, Ymax and Y min. See
below.
Go from Start – Start at the beginning of data (most
recent) and proceed to the next instance of the „jump
to” drop down dialog (memo in Figure 4-13.3)
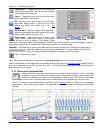
Trace Setup – Tapping this icon will bring up the
Trace Setup screen (see Figure 4-13.3), which
enables the user to shut off traces on the display. Those
traces not on the original trend will be grayed out. Check the box next to the trace you want displayed, uncheck it
to remove the trace from the browse trend. Traces can be turned on or off at any time.
Slider Bar – The Slider Bar is used to scroll back and forth through the data buffer. Sliding to the left brings up
older data, sliding to the right brings up newer data. To move, press the slider with the
stylus (or finger) and drag, or tap the bar to the left or right of the slider.
Exit - Returns to live data.
Note: The browser will always be in the form of a horizontal trend even if the live trend is vertical.
When in the browser, double-tapping the trend display area will take you to the Annotate Dialog window. Here the
user can markup the current view and save it or print it. This permits annotating historic data which may have
been missed on the live trend.
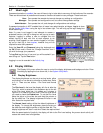
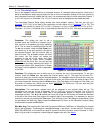
4.13.1 Zoom and Compress Data
Using the Zoom % drop down menu the user can select to zoom (numbers > 100) or compress
(numbers <100) the time axis of data on the screen. Simply select the zoom value and the trend
display will recalculate and display the compressed or zoomed data. 100% Zoom is the normal
representation on the trend. It may take some time to recalculate the view depending on the zoom level.
Figure 4-13.4 below, shows data zoomed 5 times with the point markers turned on. Figure 4-13.5 shows data
compressed 5 times without point markers. The slider bar will navigate through the data at the zoom level
selected.