Debugger db63 (1)
Development Tools
Outline
This software performs debugging by controlling the ICE hardware
tool. Commands that are used frequently, such as break and step,
are registered on the tool bar, minimizing the necessary keyboard
operations. Moreover, sources, registers, and command execution
results can be displayed in multiple windows, with resultant
increased efficiency in the debugging tasks.
Windows
Start-up Command Usage
-Usage-
db63.exe parameter file name <startup options>
Options:
command file: ... specifies a command file
-comX(X:1-4) ... com port, default com1
-b ... baud rate, 2400, 4800, 9600(default), 19200, 38400
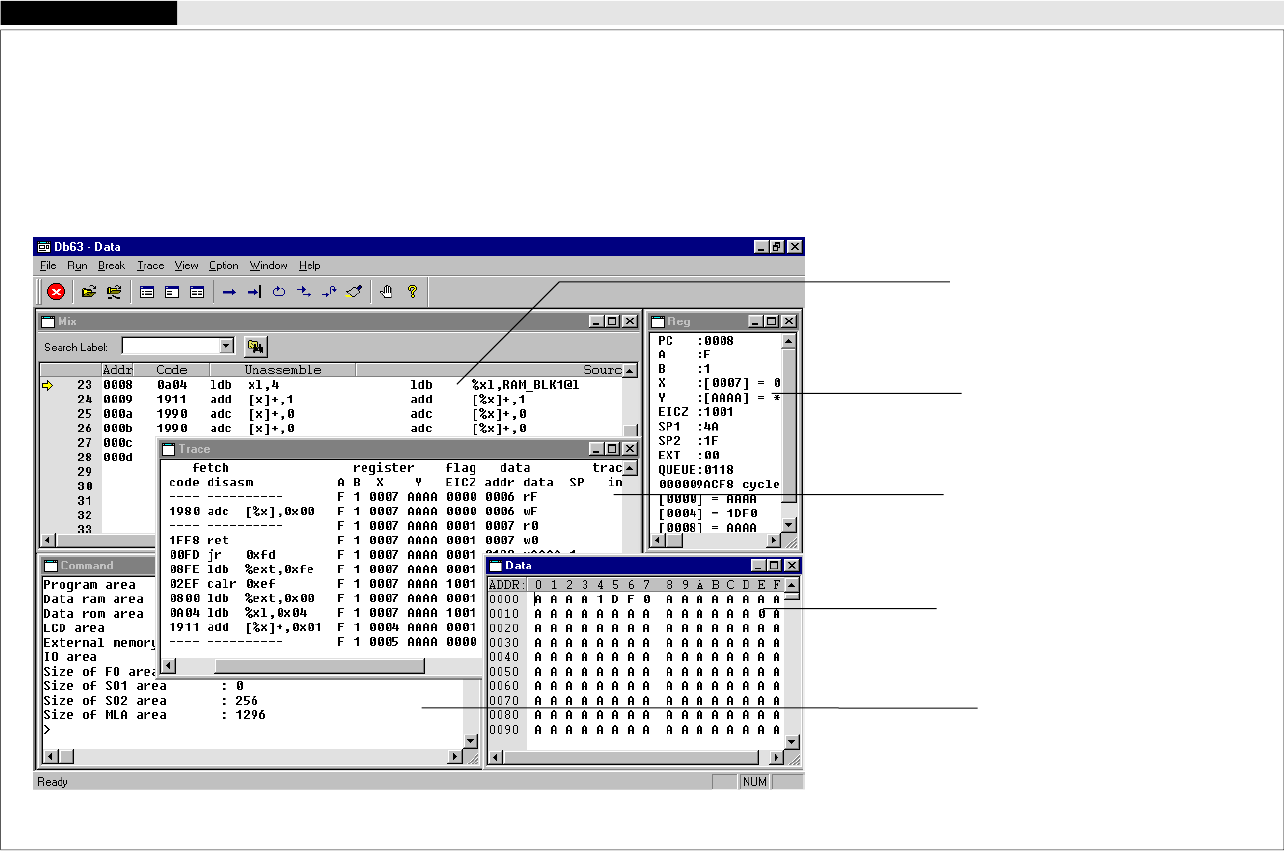
[Source] window
Displays programs with unassemble codes, source codes or
disassemble and source codes.
[Register] window
Displays register values and monitor data.
[Trace] window
Displays traced data.
[Data] window
Displays the contents of the data memory.
[Command] window
Used to enter debug commands and display the execution results.


