


AI296 Version 9.8x User’s Guide
AI296 Commands: diag-eth
9-29
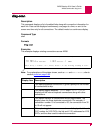
diag-eth
Description
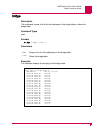
This command monitors and displays Ethernet diagnostic information.
Using Interpretation Mode
There are three levels of diagnostic information:
z Minimum—Displays minimal diagnostic information (mostly the packet’s source
and destination). This is the default interpretation mode setting.
z Medium—Displays protocol fields that are likely to change for each packet, as
well as those with values that are out of the ordinary.
z Maximum—Displays all protocol fields.
To configure interpretation mode:
1. At the prompt, enter
diag-eth.
2. Enter
interpret minimum, interpret medium, interpret maximum, or
interpret.
Tip: Entering interpret with no additional parameter toggles interpretation off
and on. When interpretation is toggled from off to on, the diagnostic level is
set to the minimum level (the default).
Using the Timestamp Option
Timestamps can be configured to appear on the diagnostic display. The timestamp
value displays the calendar date and time.
To enable or disable timestamp display:
1. At the prompt, enter diag-eth.
2. Enter
timestamp to toggle between enabling and disabling the display of the
timestamp.
Using Promiscuous Mode
Promiscuous mode can be enabled or disabled during Ethernet diagnostic sessions.
By disabling promiscuous mode, only packets traveling on the network that are
destined for your Ethernet card appear. By enabling promiscuous mode, all the
packets traveling on the network appear.
To enable and disable promiscuous mode:
1. At the prompt, enter
diag-eth.
2. Enter
promiscuous to toggle between enabling and disabling promiscuous mode.