Object Reference
80
4.1.10. SignalScope
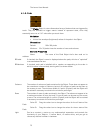
The SignalScope displays values of other Objects and variables on your
Lemur. The “trace” shows a recent history of the value of what you are monitoring.
The SignalScope is transparent to touch, meaning that you can place it on top
of Objects and still interact with them.
Variables
None
Dimensions
Default 100 x 100 pixels
Minimum 32 x 32 pixels
General Properties
Name The name of the SignalScope Object that’s also used as
its address.
Label If checked, the Object’s name is displayed in the scope area.
Mode XY If checked, the signal scope shows both an X and Y value plotted against each
other. If unchecked, the X value is time, shifting Y values to the left.
Color Drag the bar to change the color of the scope and its frame.
Behavior Properties
X = If Mode XY is enabled, X can be the value of a variable or a constant, otherwise it
is assigned to time against which the Y value will be plotted.
Y = A variable or constant expression that will be periodically evaluated and plotted
against X. For example, to plot the x variable of a Fader Object called chan1,
enter chan1.x in the text field.
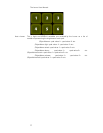
Time base = Corresponds to the time (in seconds) displayed on the scope. As the Time base
increases, individual elements of the graph will decrease in width as more of the
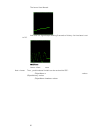
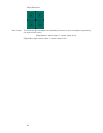
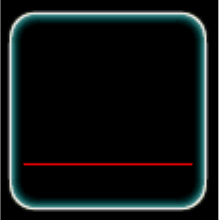
“past” is shown. The picture below shows a SignalScope displaying a tenth of a
second of history. It is set to time base of 0.1:


