


150 Microsoft Visual Studio 2010: A Beginner’s Guide
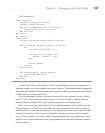
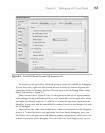
If you’ve been working on your code and want to update the Call Hierarchy window,
click Refresh. Every time you view Call Hierarchy, the selected item is added to the list. You
can use the Remove Root button to delete an item from the list. The
Toggle Details Pane
button shows and hides the Details pane, which shows the code and location of the call site.
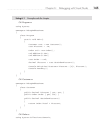
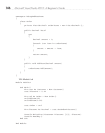
In Figure 6-1, the Main method is selected, which shows the call to GetOrderDiscounts off
the cust instance of Customer from Listing 6-1. The actual code line is shown also. You can
double-click the statement to navigate the editor to the location of that statement. In fact, you
can double-click any call site in the Call Hierarchy to navigate to the location of the call site
in the editor.
The Call Hierarchy shows all of the possible paths you can take through a specific
point in code. While quite useful, it’s limited to providing a static view of your code, and
it does not provide the detailed insight into your running program that debugging may
require. When debugging, you typically need to view the running state of an application at
a specific point in time. The following sections show you various features of the debugger
that help you inspect the runtime behavior of code.
Configuring Debug Mode
By default, VS creates projects with Debug mode enabled, which specifies project settings
that make it possible for you to debug your application. The VS toolbar shows you the
current configuration settings you’re using; clicking the drop-down list will show Debug
and Release configurations. The Release configuration defines settings for your program
that you want to use when you deploy it for production (actual) use. Y
ou can also create
a custom configuration that allows you to set project properties how you want. For the
purposes of this chapter, we will use the Debug configuration.
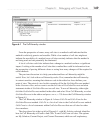
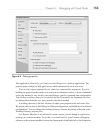
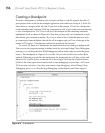
To understand what the Debug configuration gives you, ensure that the Debug configuration
is selected in the toolbar; you’ll need to have a project open to do this. Then double-click the
properties folder of your project and click the Build tab as shown in Figure 6-2.
Figure 6-2 shows that optimizations are turned off and both TRACE and DEBUG are
defined. Figure 6-2 shows the properties for a C# project, but in VB, the tab is called
Compile. When optimizations are turned on, the compiler will perform extra processing
on the code that makes it smaller and faster, altering the structure of the code. When
debugging, you don’t want optimizations because you need the code you’re stepping
through to match what the compiler produces. Compiler constants (also known as
compiler directives) such as TRACE and DEBUG are used by the compiler to enable or
disable blocks of code. For example, the System.Diagnostics namespace has a Debug
class that will only work if DEBUG is defined.