


158 Microsoft Visual Studio 2010: A Beginner’s Guide
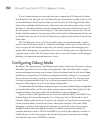
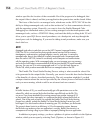
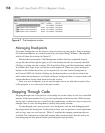
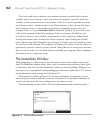
Figure 6-7 The Breakpoints window
Managing Breakpoints
Over time, breakpoints can be set across many locations in your project. You can manage
all of these breakpoints in a central location by selecting Debug | W
indows | Breakpoints,
which will show the window in Figure 6-7.
Much of the functionality of the Breakpoints window has been explained already,
except that the toolbar options apply to all of the breakpoints that are currently checked.
Clicking a column sorts the contents. The Search box helps you filter breakpoints, and the
In Columns box helps focus on what the search applies to. There are export and import
buttons on the toolbar that allow you to respectively save and retrieve breakpoints to
and from an XML file. Double-clicking any breakpoint takes you to the location in the
editor where the breakpoint is set. Right-clicking a breakpoint shows a context menu with
options that have already been discussed in this section.
Once you set a breakpoint, you can step through code to see what the execution flow
of the program is, as is discussed in the next section.
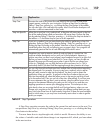
Stepping Through Code
Stepping through code is the process of executing one or more lines of code in a controlled
manner. At the most granular level, you can step through code line-by-line. While moving
line-by-line is often necessary, it could also be cumbersome, so there are ways to step over
multiple lines of code, allowing them to silently and quickly execute.
To step through code, open a project, set a breakpoint, and run with debugging until
the program hits the breakpoint. At that point in time, you can perform various operations
such as step, step over, and step out. Table 6-2 explains the stepping operations that are
available. The explanations in the table assume that a breakpoint has been hit with your
executing program now paused before performing the step operation.