


Chapter 6: Debugging with Visual Studio 165
VS will locate the pinned value after the line, and you might not see the value if it
occurs on a long line that exceeds the width of your screen. Fortunately, you can click the
pinned value and drag it to where you want on the screen. To avoid confusion, remember
to keep the pinned value located close to the variable whose value is displayed.
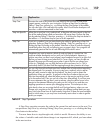
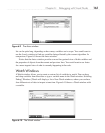
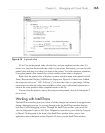
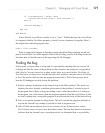
Right-click the pinned value to display a context-sensitive menu with options for Edit
Value | Hexadecimal Display | Add/Remove Expression. Figure 6-14 shows how I added
the expression (discount * 100) .ToString("p") to show the value as a percentage. Adding
expressions can make the value more readable or allow you to add related expressions to
see how the value produces other computed results on the fly.
You can close the pinned value by hovering over the pinned value and clicking the X
(close icon).
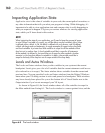
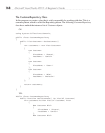
Working with IntelliTrace
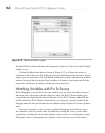
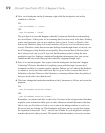
The IntelliTrace window gives you a view of all the changes that occurred in an application
during a debugging session. As you step through code, the IntelliTrace window displays
each step of your debugging session. Through the IntelliTrace toolbar, you can set the
view for Diagnostic Events or Call View. Diagnostic events allow you to filter by Category
or Thread. Clicking each of the items of the IntelliTrace window allows you to view
application state at that point in time. Figure 6-15 shows you the IntelliTrace window.
Figure 6-14 A pinned value