


Chapter 6: Debugging with Visual Studio 163
The Call Stack Window
If you recall from the previous section on design-time tools, the Call Hierarchy window
gives you a view of the code at design time. On a related note, you also have the ability to
view the path of execution during runtime via the Call Stack window. During debugging,
you may find the Call Stack window already open on the right-bottom of VS in a tab next
to the Immediate window if you’ve not changed your layout and depending upon your
initial VS environment setup. Otherwise, you can open this window by selecting Debug |
Windows | Call Stack from the top menu bar. With the Call Stack window, you can view
the current execution path of the application from Main to where your current line of
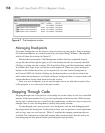
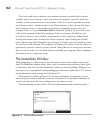
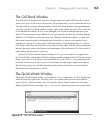
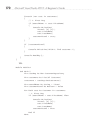
execution is. Figure 6-12 shows the Call Stack window. To understand why it’s called a
Call Stack, notice that each method call is stacked on the other with the current method at
the top, the entry point at the bottom, and subsequent calls in between; it’s like a stack of
plates where the last plate is at the top.
In the Call Stack window, shown in Figure 6-12, you can see that I’ve stepped into
the GetOrderDiscount method. Double-clicking another method in the Call Stack window
brings you to the call site where a given method was called. This is a very important and
powerful tool because it allows you to visit calling code and inspect application state at
the call site, giving you valuable information about how calculations were formulated
before the current method was called.
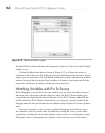
The Quick Watch Window
The Quick Watch window allows you to quickly view an expression. It offers Intellisense
when writing the expression, allowing you to reevaluate the expression and add the
expression to a Watch window. You can open the Quick Watch window by selecting
Debug | Quick Watch or pressing
CTRL-D, Q. If you’ve selected an expression in the editor,
Figure 6-12 The Call Stack window