


166 Microsoft Visual Studio 2010: A Beginner’s Guide
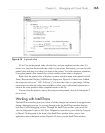
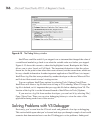
IntelliTrace could be useful if you stepped over a statement that changed the value of
a variable and needed to go back to see what the variable value was before you stepped.
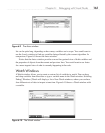
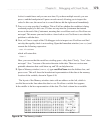
Figure 6-15 shows this scenario, where the highlighted event, Breakpoint hit: Main,
allows you to view Locals or Call Stack. The important distinction is that the values
shown are for the point in time when that event occurred, not the current time, which can
be very valuable information. Another important application of IntelliTrace is to inspect
IntelliTrace log files that were produced by another developer or the new Microsoft Test
and Lab tool that records a tester’s testing session.
You can configure IntelliTrace options by selecting Tools | Options | IntelliTrace.
IntelliTrace will create a log file that exists as long as VS is running. When VS stops, the
log file is deleted, so it’s important that you copy this file before shutting down VS. The
location of the log file is on the Advanced branch of IntelliTrace in Tools | Options.
If you receive a log file from another developer, you can load it by selecting File |
Open | Open New. Then you can view debugging history to view the state of the
application during each event of the session.
Solving Problems with VS Debugger
Previously, you’ve seen how the VS tools work and gathered a few tips on debugging.
This section builds upon what you’ve learned and steps you through a couple of real-world
scenarios that demonstrate how to use the VS debugger to solve problems: finding and
Figure 6-15 The Debug History window