Administration
84
N150 Wireless ADSL2+ Modem Router DGN1000Bv3
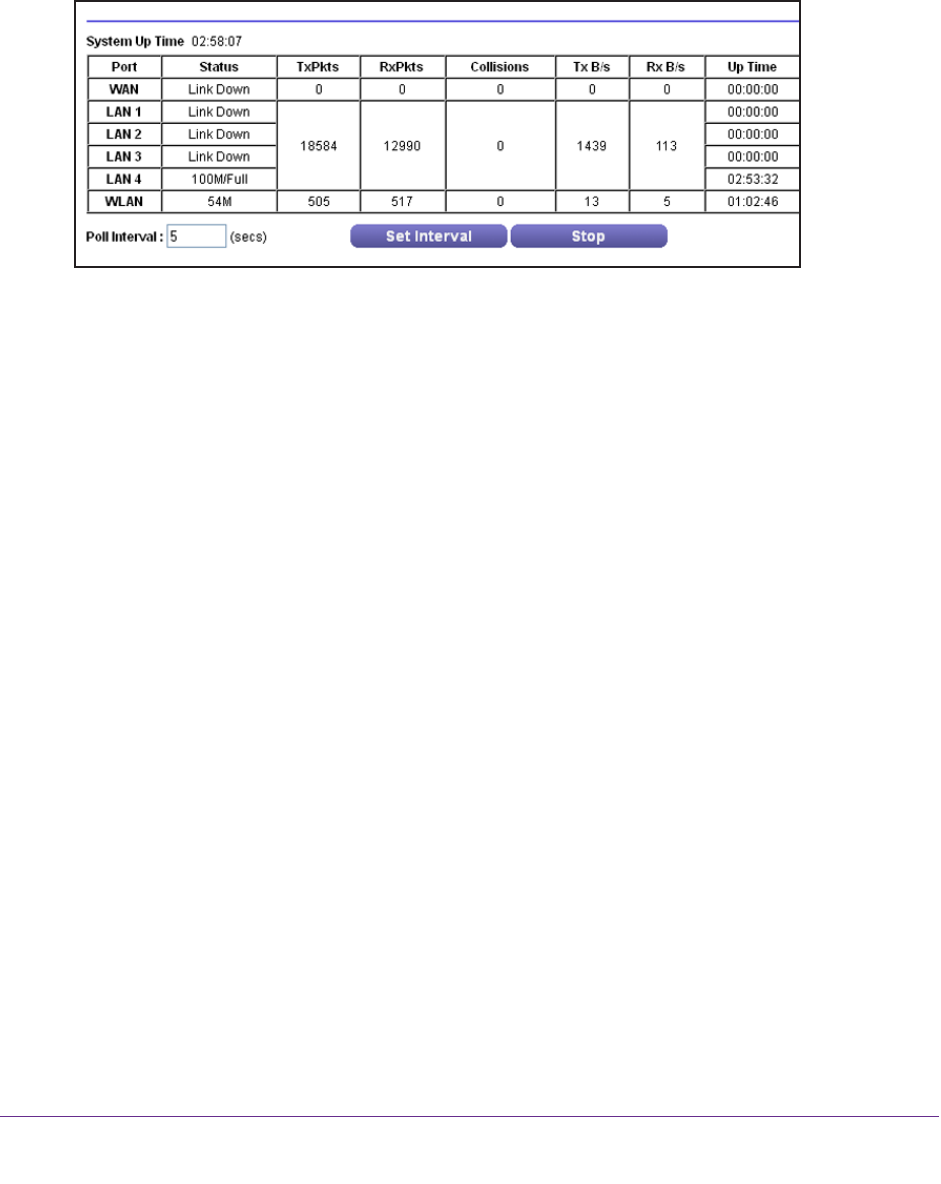
Statistics Screen
To view statistics:
1. Depending on the screen that you have open, select ADVANCED or ADV
ANCED
Home.
2. In the Internet Port pane, click the Show Statistics button.
The following information is displayed:
• System Up Time.
The time elapsed since the modem router was last restarted.
• Port. The statistics for the WAN (Internet), four LAN (Ethernet) ports, and WLAN
(wireless LAN) port. For each port, the screen displays:
- Status. The link status of the port.
- TxPkts. The number of packets transmitted on this port since reset or manual clear.
- RxPkts
. The number of packets received on this port since reset or manual clear.
- Collisions
. The number of collisions on this port since reset or manual clear.
- Tx B/s
. The current transmission (outbound) bandwidth used on the WAN and LAN
ports.
- Rx B/s
. The current reception (inbound) bandwidth used on the WAN and LAN ports.
- Up Time
. The time elapsed since this port acquired the link.
• Poll Interval. The interval at which the statistics are updated in this screen.
To change the polling frequency:
1. In the Poll Interval field, enter a time in seconds.
2. Click the Set Interval button.
To stop the polling:
Click the Stop button.
Connection Status Screen
To view and change the Internet connection status:
1. Depending on the screen that you have open, select ADVANCED or ADV
ANCED
Home.
