


Measurements Modulation Measurements
MS278XB OM 5-69
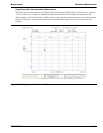
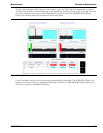
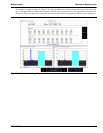
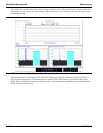
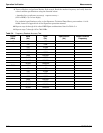
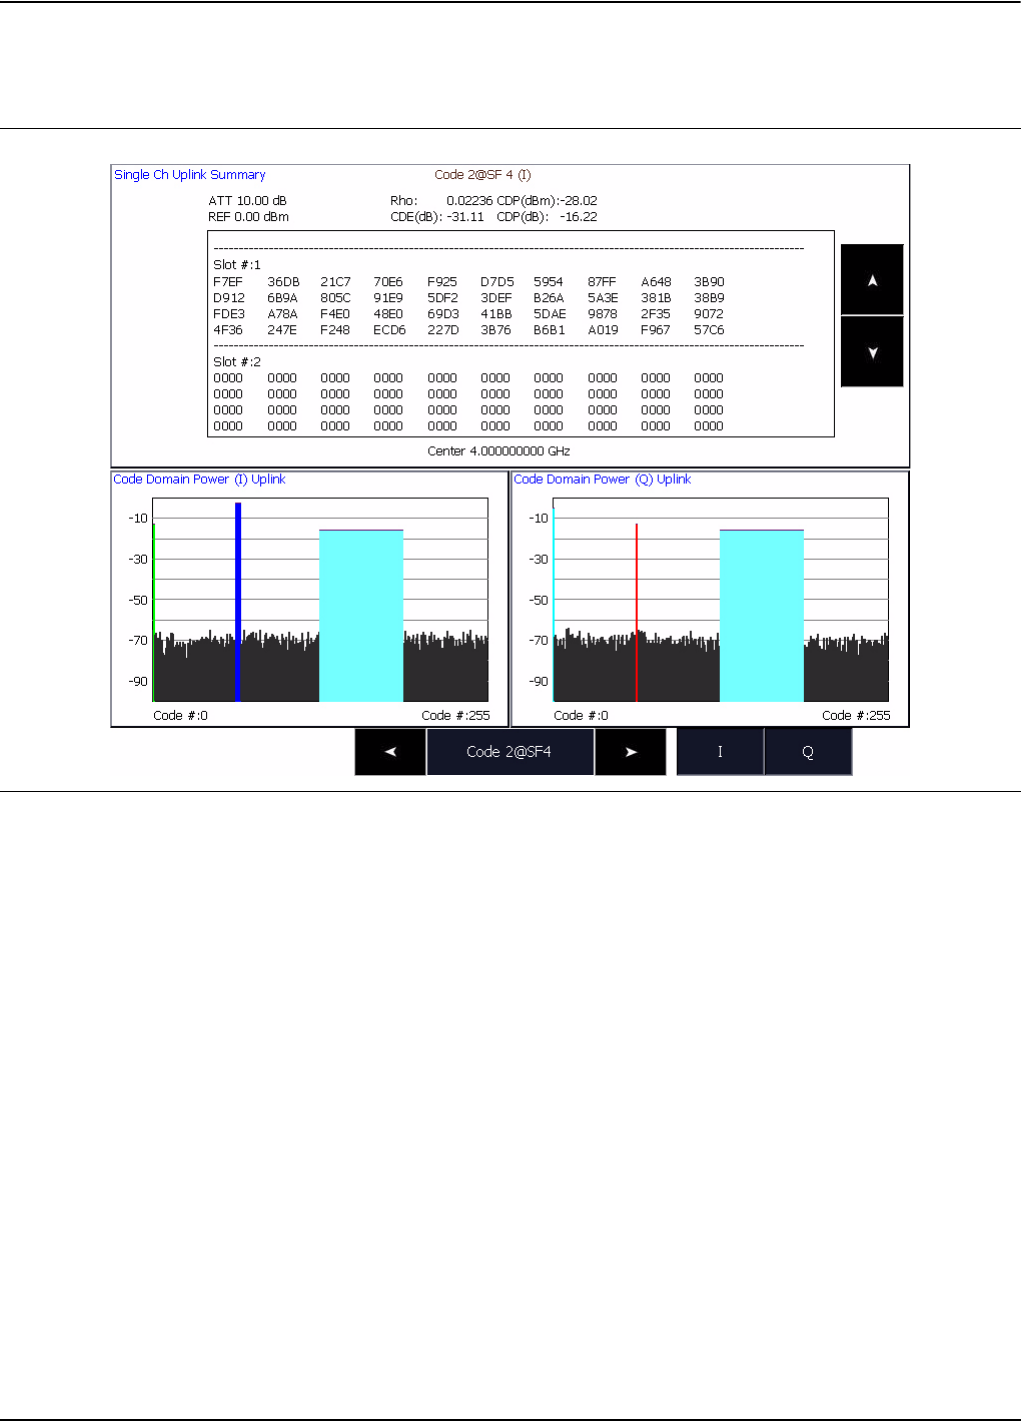
The summary graph is shown in Figure 5-46. The top half of the display shows the detected data for each
slot of the code channel. When the I-button is clicked, the detected data for the programmed I-channel is
displayed. When the Q-button is pressed, the detected data for the programmed Q-channel is displayed.
Figure 5-46. Code Domain Single Channel with Summary