


Instrument Overview Graphical User Interface Overview
MS278XB OM 3-31
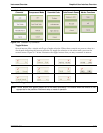
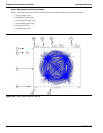
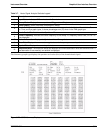
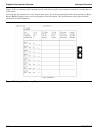
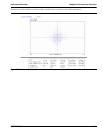
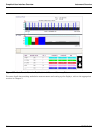
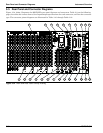
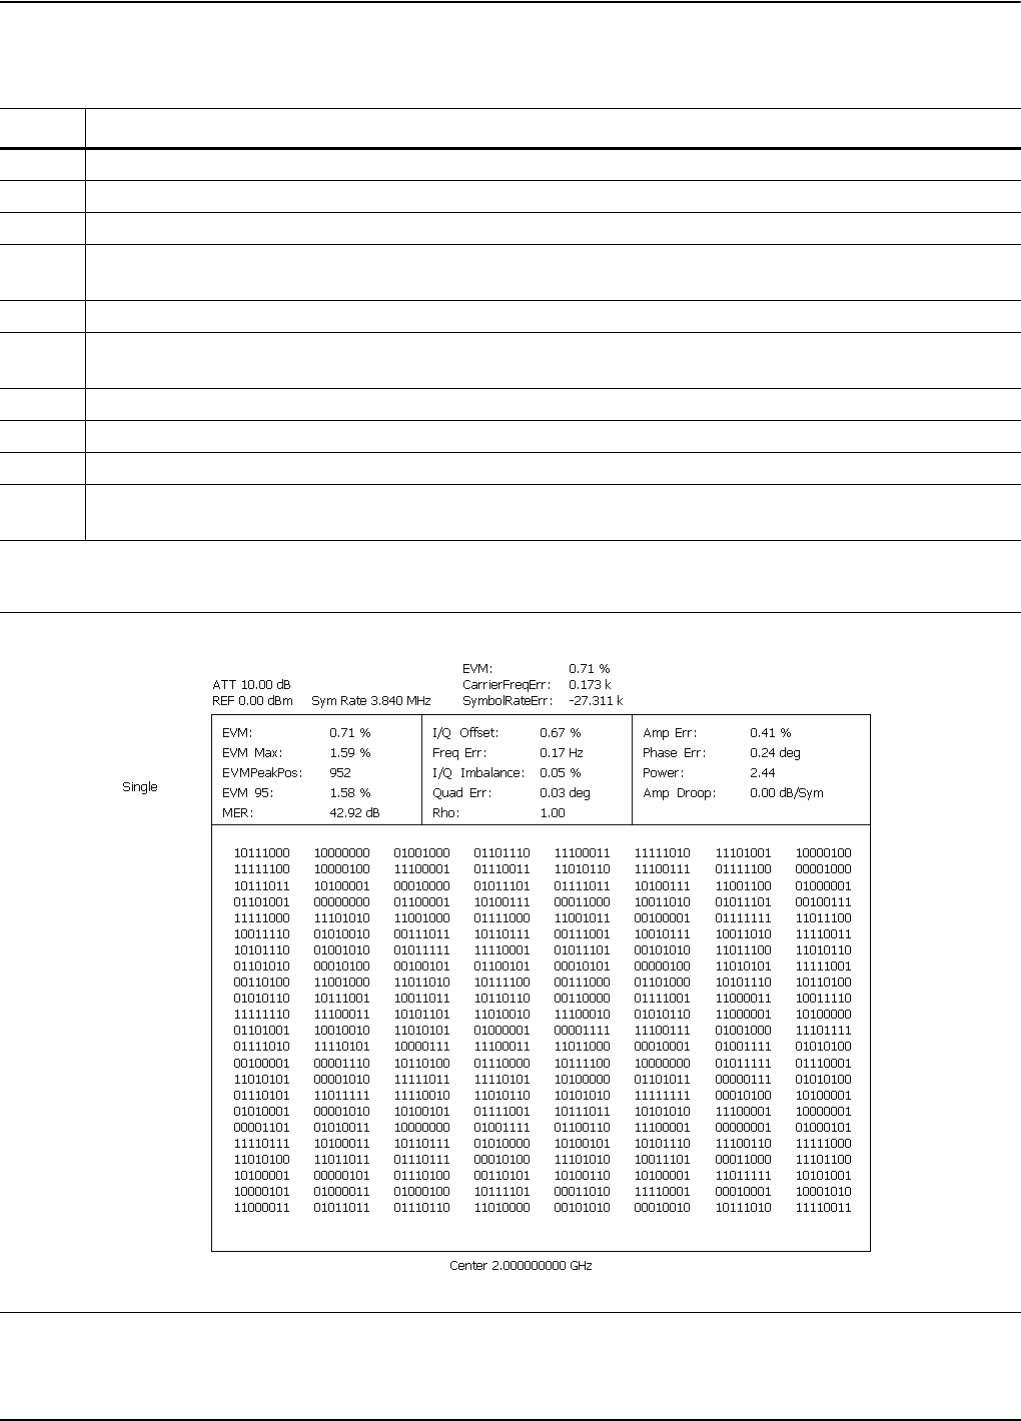
The Summary graph type displays the position and value (bits) of the demodulated signal.
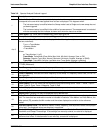
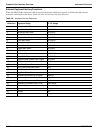
Table 3-7. Vector Signal Analysis Graticule Legend
Index Description
1 Input Status: Indicates ADC overload and L.O. unlock.
2 Sweep Status: Displays the sweep status of Triggered and Single sweep modes.
3 Trace Display: Vector trace data is displayed in Yellow.
4
Y-axis Scale: This scale shows the normalized I and Q range when in the Vector, Constellation, Power
vs. Time, and Eye graph types; it shows percentage error (%) when in the EVM graph type.
5 X-axis Scale: This field shows the Symbols or Time.
6
Center Frequency: Indicates the center frequency of the sweep. If a frequency offset is set, OFFSET is
also displayed.
7 Marker Information: Displays the Symbol and I and Q magnitude.
8 Error Data: Displays the error vector magnitude, carrier frequency error, and symbol rate error.
9 Symbol Rate: Displays the current symbol rate
10
Amplitude Setup: The amplitude setup field displays the current attenuation level and reference level. If
the attenuation is set manually, an asterisk is displayed.
Figure 3-29. QPSK Summary Display