


Modulation Measurements Measurements
5-70 MS278XB OM
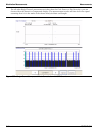
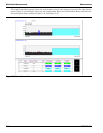
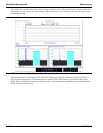
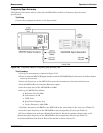
The Code Power vs. Slot Overview graph is shown in Figure 5-47. The top half of the display shows the
code power at each slot for the code channel. The yellow plot is the I-channel code and the green plot is
the Q-channel code.
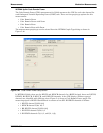
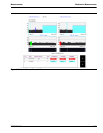
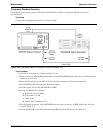
The measurement of the selected code channel is displayed in both the Summary and Code Power vs.
Slot Overview graph types. The measurements include CDP, CDE, and the waveform quality factor
(Rho). The measurement results are shown for the I- or Q-channel as programmed in the Code Domain
Single Channel Setup dialog.
Figure 5-47. Code Domain Single Channel—Code Power vs. Slot Overview