


Graphical User Interface Overview Instrument Overview
3-26 MS278XB OM
Graticule
The Graph area is the main container for all of the measurement displays. The primary element in this area is
the trace data on a graticule display. Annotations provide feedback on the instrument’s hardware setup for the
measurement as well as measurement related warnings and status messages outside of the graticule area.
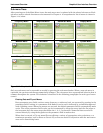
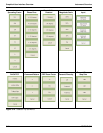
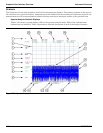
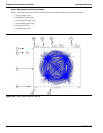
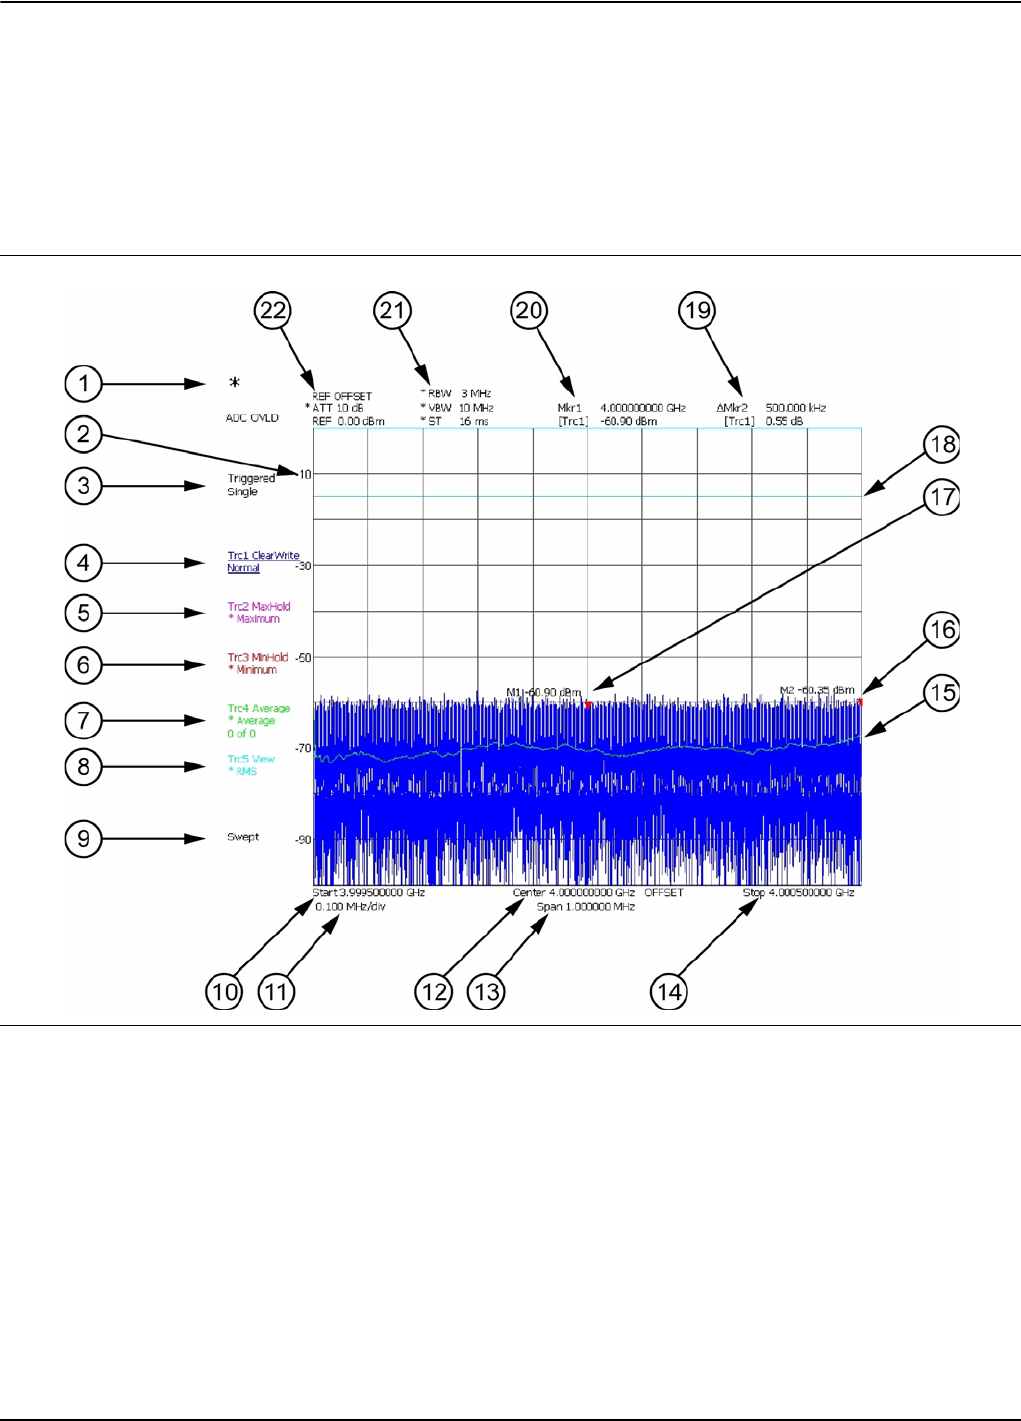
Spectral Analysis Graticule Displays
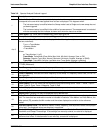
Figure 3-21 shows a typical display while in the spectral analysis mode. Most of the informational
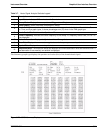
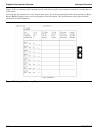
annotations are indicated. Table 3-6 provides a detailed description of each of the display elements.
Figure 3-21. Spectral Analysis Graticule