SECTION 11. OUTPUT PROCESSING INSTRUCTIONS
11-2
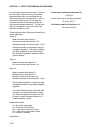
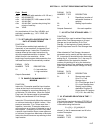
In an example where the scan rate is 1 second
and the Output Flag is set every 60 minutes,
the standard deviation is calculated from all
3600 scans when the sub-interval is 0. With a
sub-interval of 900 scans (15 minutes) the
standard deviation is the average of the four
sub-interval standard deviations. The last sub-
interval is weighted if it does not contain the
specified number of scans.
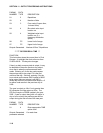
There are three Output Options that specify the
values calculated.
Option 0:
Mean horizontal wind speed, S.
Unit vector mean wind direction, Θ1.
Standard deviation of wind direction, σ(Θ1).
Standard deviation is calculated using the
Yamartino algorithm. This option complies
with EPA guidelines for use with straight-
line Gaussian dispersion models to model
plume transport.
Option 1:
Mean horizontal wind speed, S.
Unit vector mean wind direction, Θ1.
Option 2:
Mean horizontal wind speed, S.
Resultant mean wind speed, U.
Resultant mean wind direction, Θu.
Standard deviation of wind direction, σ(Θu).
This standard deviation is calculated using
Campbell Scientific's wind speed weighted
algorithm.
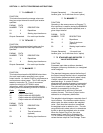
Use of the Resultant mean horizontal wind
direction is not recommended for straight-
line Gaussian dispersion models, but may
be used to model transport direction in a
variable-trajectory model.
Measured raw data:
S
i
= horizontal wind speed
Θ
i
= horizontal wind direction
Ue
i
= east-west component of wind
Un
i
= north-south component of wind
N = number of samples
Calculations:
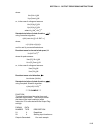
Scalar mean horizontal wind speed, S:
S=(ΣS
i
)/N
where in the case of orthogonal sensors:
S
i
=(Ue
i
2
+Un
i
2
)
1/2
Unit vector mean wind direction, Θ1:
Θ1=Arctan (Ux/Uy)


