74 Monitoring PowerVault NX3500
Dashboard
The Dashboard page is displayed by default when you click the Monitor tab.
It shows the status of the entire system in a single view. The Dashboard page
includes five real-time and short-term sections:
• Status
• Capacity
• Current Performance
• Recent Performance
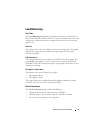
• Load Balancing
NOTE: The information in the screen is refreshed automatically every few seconds.
Status
The Status section displays the system status and a list of hardware
components. Each hardware component type displays the total number of
components and the number of problematic components. The list includes
controllers and the Backup Power Supply (BPS). The power section of the
controllers refers to the BPS.
Component Status
Allows you to see the connectivity, power, and hardware
status of each controller.
Capacity
Space Utilization
Allows you to see free space, non-snapshot used space,
and snapshot used space for each NAS volume for last
day, last week, last month, and last year.
Quota Usage
Allows you to see the quota usage for each NAS volume
for users and groups.
Replication
NAS Replication
Allows you to see a list of NAS replication events.
NDMP
NDMP Active Jobs
Allows you to see a list of NDMP active jobs.
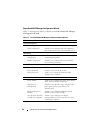
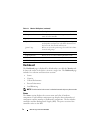
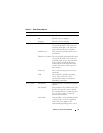
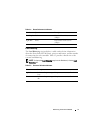
Table 4-1. Monitor Tab Options
(continued)
Field Description


