


Monitoring PowerVault NX3500 79
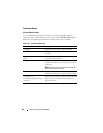
Load Balancing
Over Time
The Load Balancing Over Time page displays the balance in load between
PowerVault NX3500 controllers over time. The screen includes four tabs, each
tab presents a different period, for example, last day, last week, last month,
and last year.
CPU Load
The top left side of the screen displays the processor load graph. This graph
displays the average processor utilization in percentage for each of the
selected controllers.
CIFS Connections
The top right side of the screen displays the CIFS Connections graph. The
graph displays the number of active connections for each of the selected
controllers. Only CIFS connections appear in the graph (NFS clients are not
connection oriented).
Throughput—Read or Write
The bottom of the screen displays two graphs:
•Throughput—Read
•Throughput—Write
The graphs display the combined actual throughput, excluding overhead
(read and write) for each of the selected controllers.
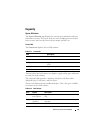
Client Connections
The Client Connections page enables the following:
• Display the distribution of clients between controllers.
• Manually migrate specific clients from one controller to another.
• Set the policy for automatic client migration.