


Appendix A. Operating systems specifics 301
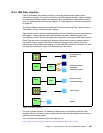
the data, even if this pool spans several ranks. If possible, the extents for one logical volume
are taken from the same rank.
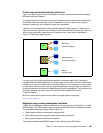
To get higher throughput values than a single array can deliver, it is necessary to stripe the
data across several arrays. This can only be achieved through striping on the host level.
To achieve maximum granularity and control for data placement, you will have to create an
extent pool for every single rank.
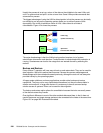
However, some operating systems support only a limited number of attached disks, or make it
difficult for the administrator to combine several physical disks into one big volume. In the
DS6000 logical volumes cannot span several extent pools. To be able to create very large
logical volumes, you must consider having extent pools that include more than one rank.
UNIX performance monitoring tools
Some tools are worth discussing because they are available for almost all UNIX variants and
system administrators are accustomed to using them. You may have to administer a server
and these are the only tools you have available to use. These tools offer a quick way to tell
whether a system is I/O bound:
iostat
sar
(System Activity Report)
vmstat (Virtual Memory Statistics)
IOSTAT
The base tool for evaluating I/O performance of disk devices for UNIX operating systems is
iostat. Although available on most UNIX platforms, iostat varies in its implementation from
system to system.
The
iostat command is useful to determine whether a system’s I/O load is balanced or
whether a single volume is becoming a performance bottleneck. The tool reports I/O statistics
for TTY devices, disks, and CD-ROMs. It monitors I/O device throughput and utilization by
observing the time the disks are active in relation to their average transfer rates.
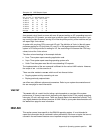
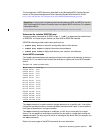
Example A-1 shows a sample
iostat output, taken on an AIX host. It shows disk device
statistics since the last reboot.
Example: A-1 AIX iostat output
#iostat
Disks: % tm_act Kbps tps Kb_read Kb_wrtn
hdisk0 0.0 0.3 0.0 29753 48076
hdisk1 0.1 0.1 0.0 11971 26460
hdisk2 0.2 0.8 0.1 91200 108355
cd0 0.0 0.0 0.0 0 0
Tip: I/O activity monitors, such as iostat, have no way of knowing whether the disk they
are seeing is a single physical disk or a logical disk striped upon multiple physical disks in
a RAID array. Therefore, some performance figures reported for a device, for example,
%busy, could appear high.