302 DS6000 Series: Concepts and Architecture
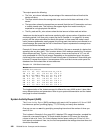
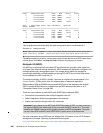
The output reports the following:
The %tm_act column indicates the percentage of the measured interval time that the
device was busy.
The Kbps column shows the average data rate, read and write data combined, of this
device.
The tps column shows the transactions per second. Note that an I/O transaction can have
a variable transfer size. This field may also appear higher than would normally be
expected for a single physical disk device.
The Kb_read and Kb_wrtn columns show the total amount of data read and written.
iostat can also be issued for continuous monitoring with a given number of iterations and a
monitoring period. It will then print a report like that in Example A-1 on page 301 for every
period, with the values calculated for exactly this period. In most cases this mode is more
useful, because bottlenecks mostly appear only during peak times and are not reflected in an
overall average. Be aware that the first in the series of reports represents the average since
boot and should be discarded.
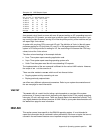
Example A-2 shows an
iostat report from SUN Solaris. You see an example of a device that
appears to be very busy (sd1). The r/s column shows 124.3 reads per second; the %b column
shows 90 percent busy. The svc_t column, however, shows a service time of 15.7 ms, still
quite reasonable for 124 I/Os per second. Depending on the application layout, this report
could lead to the conclusion that the I/O load of this system is unbalanced. Some disks get a
lot more I/O request than others. A consequence of this could be to move certain parts of a
database from the busiest disks to less used ones.
Example: A-2 SUN Solaris iostat output
#iostat -x
extended disk statistics
disk r/s w/s Kr/s Kw/s wait actv svc_t %w %b
fd0 0.0 0.0 0.0 0.0 0.0 0.0 0.0 0 0
sd1 124.3 14.5 3390.9 399.7 0.0 2.0 15.7 0 90
sd2 0.7 0.4 13.9 4.0 0.0 0.0 7.8 0 1
sd3 0.4 0.5 2.5 3.8 0.0 0.1 8.1 0 1
sd6 0.0 0.0 0.0 0.0 0.0 0.0 5.8 0 0
sd8 0.3 0.2 9.4 9.6 0.0 0.0 8.6 0 1
sd9 0.7 1.3 12.4 21.3 0.0 0.0 5.2 0 3
The implementation of the iostat command is different for every UNIX variant. It also offers
many different options and parameters. Refer to your system documentation and the
iostat
man page for more information.
System Activity Report (SAR)
The System Activity Report (SAR) provides a quick way to tell if a system is I/O bound. SAR
has numerous options, providing paging, TTY, CPU busy, and many other statistics.
One way you can run
sar is by specifying a sampling interval and the number of times you
want it to run.
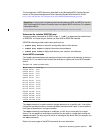
This is shown in Example A-3 on page 303. It displays CPU usage information, sampled five
times with a two second interval. To check whether a system is I/O bound, the important
column to look at is %wio. The %wio indicates the time spent waiting on I/O from
all disks,
both internal and external. Here, too, the first line represents the average since boot time and
should be discarded.


