


R0E530640MCU00 User’s Manual 5. Debugging Functions
REJ10J1733-0100 Rev.1.00 Apr. 01, 2008
Page 120 of 229
5.9 Looking at Trace Information
5.9.1 Looking at Trace Information
A trace is the function to acquire bus information every cycle and store it in trace memory during user program execution.
Using a trace you can track the flow of application execution or examine the points at which problems occurred.
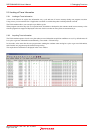
The E100 emulator allows you to acquire up to 4M bus cycles.
When program execution stops (for an exception break, forced halt or breakpoint), the contents stored in trace memory at the
time the program has stopped are displayed as the trace result even when no trace points are encountered yet.
5.9.2 Acquiring Trace Information
The E100 emulator operates in such a way that when no trace information acquisition conditions are set, it by default traces all
bus cycles to get trace information unconditionally. (Trace mode = Fill until stop)
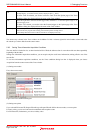
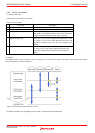
In free mode, at the same time the user program starts running the emulator starts tracing bus cycles to get trace information,
and when the user program stops the emulator stops tracing.
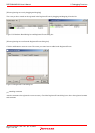
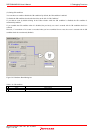
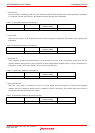
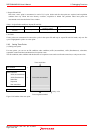
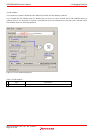
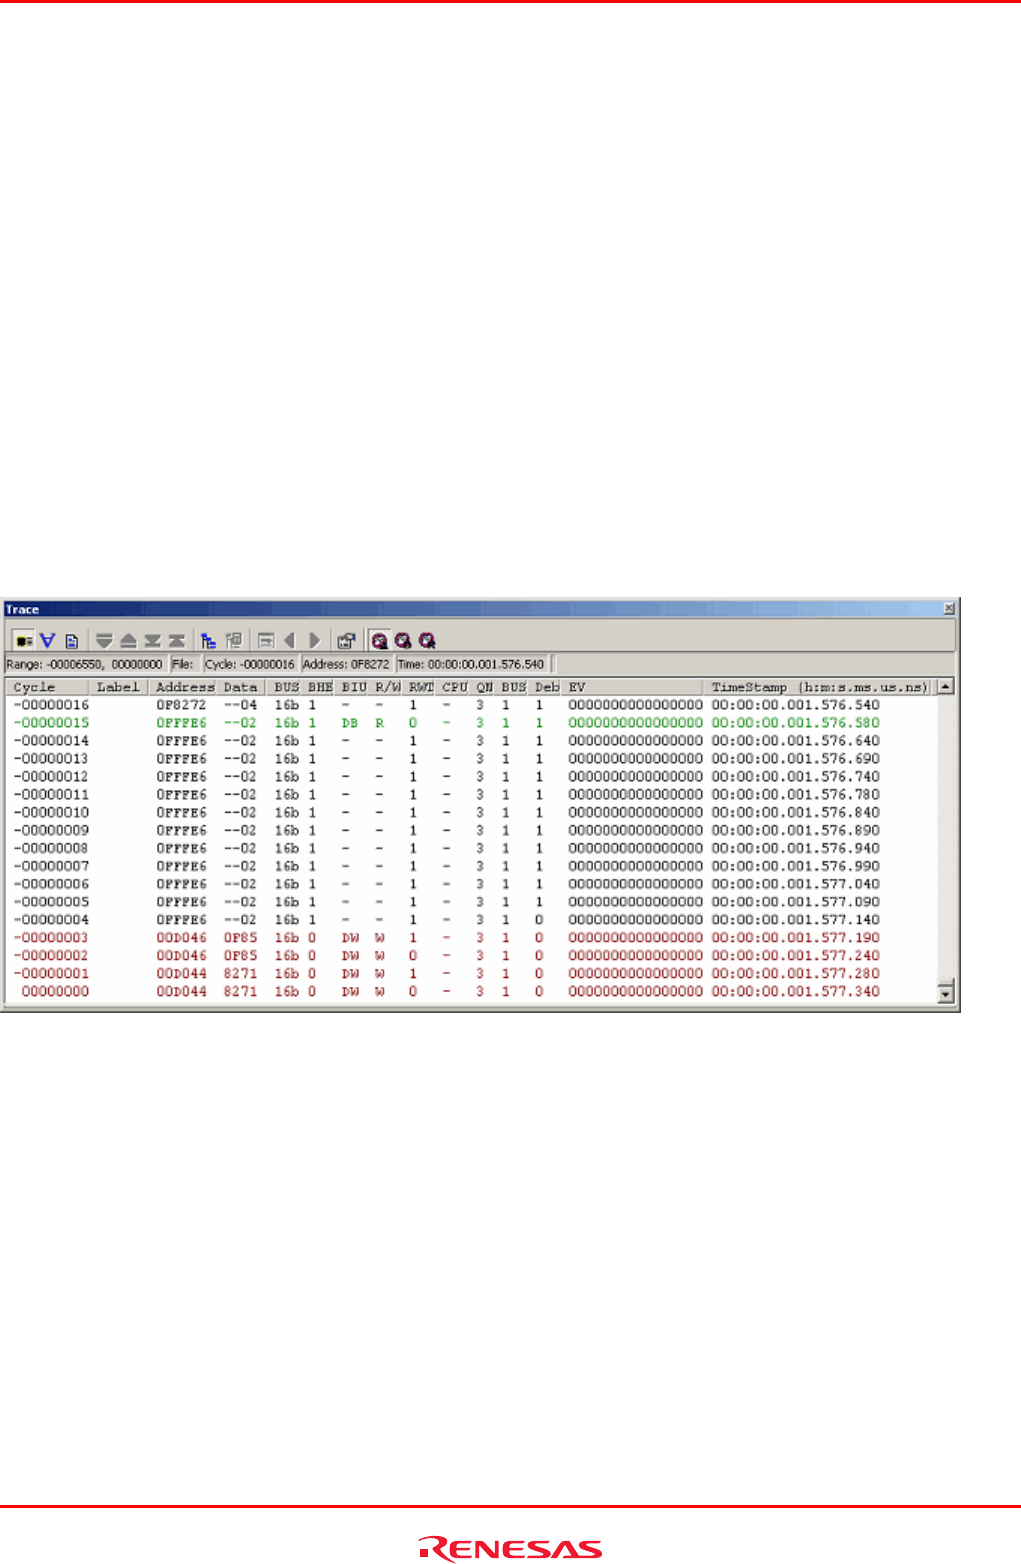
The acquired trace information is displayed in the Trace window.
Figure 5.45 Trace window