


R0E530640MCU00 User’s Manual 3. Tutorial
REJ10J1733-0100 Rev.1.00 Apr. 01, 2008
Page 62 of 229
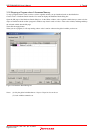
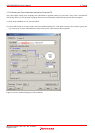
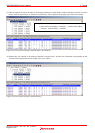
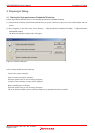
(5) Click the right mouse button anywhere in the displayed function execution history window and choose Analyze Execution
History from the context menu. A function execution history will be displayed in the upper pane of the Trace window.
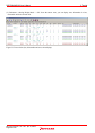
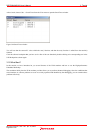
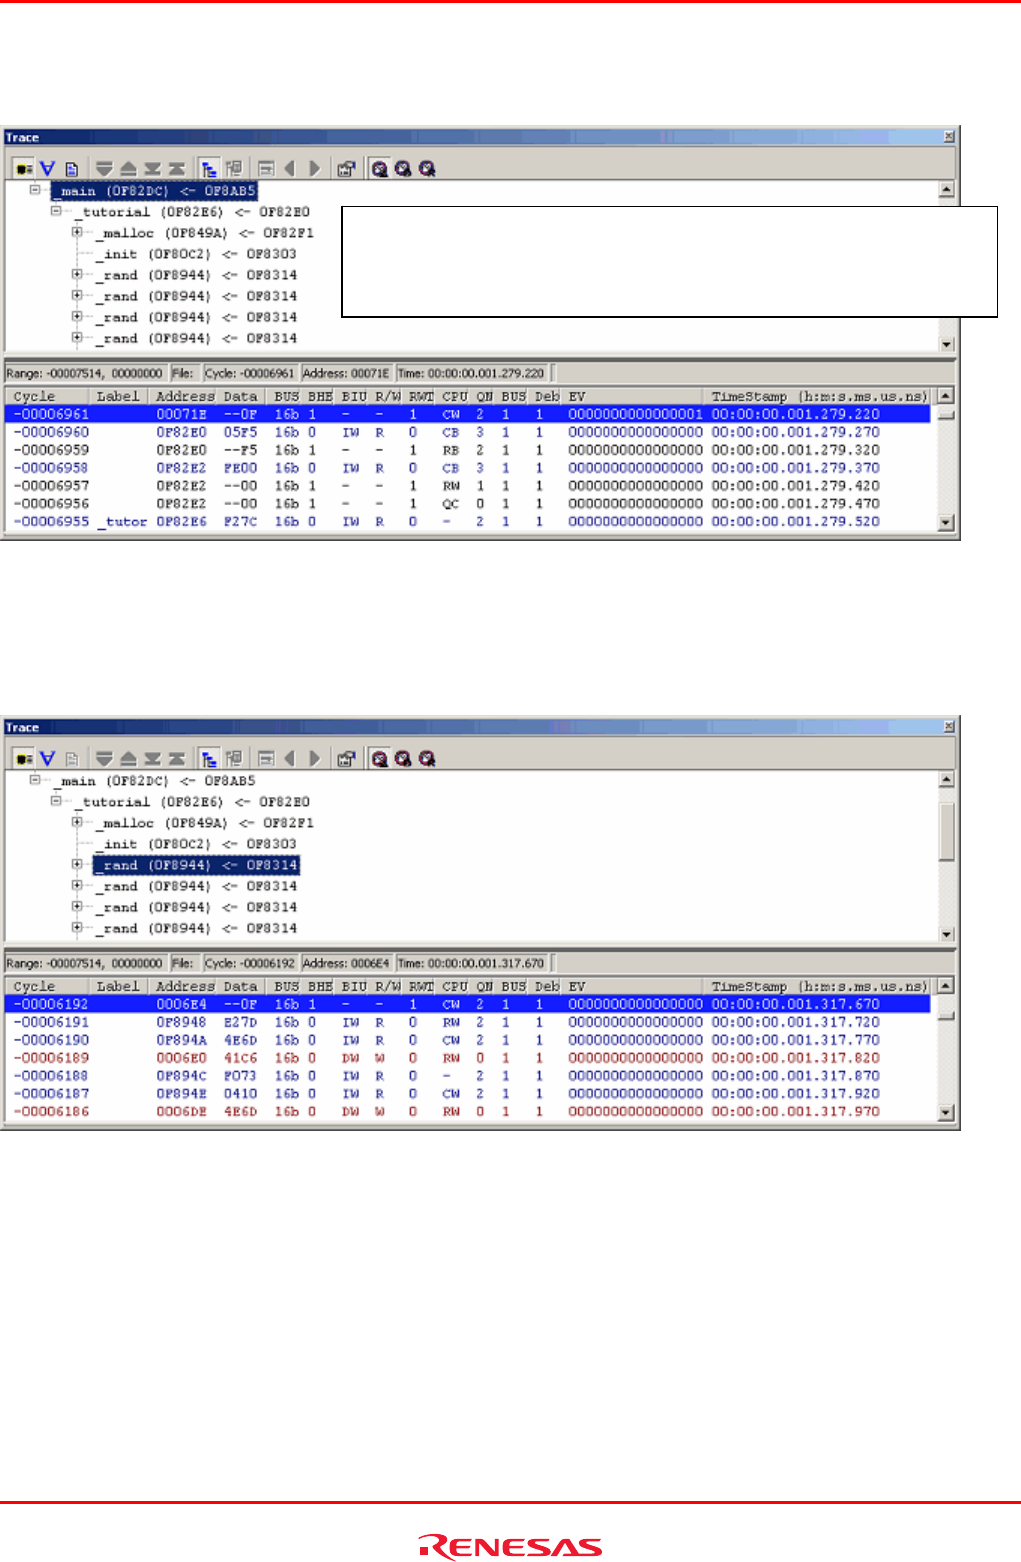
Figure 3.38 Trace window (function execution history–after analysis)
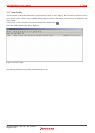
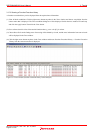
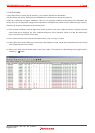
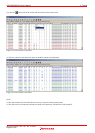
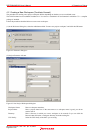
(6) Double-click any function in the displayed function execution history, and the trace information corresponding to that
function will be displayed in the lower pane of the Trace window.
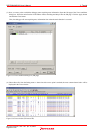
Figure 3.39 Trace window (function execution history)
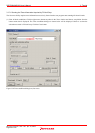
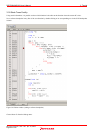
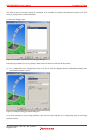
<Display form of function execution history>
Function name (start address of function) <− function caller address
Example: _main (0F82DC) <- 0F8AB5