


R0E530640MCU00 User’s Manual 5. Debugging Functions
REJ10J1733-0100 Rev.1.00 Apr. 01, 2008
Page 90 of 229
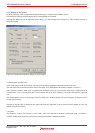
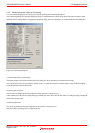
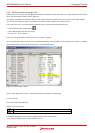
(1) Line column
Shows the line numbers corresponding to lines in the source file.
(2) Source Address column
When a program is downloaded, this column shows the addresses corresponding to lines in the current source file. This
function will prove convenient when you determine where you want the PC value or breakpoint to be set.
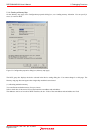
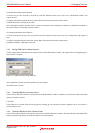
(3) Event column
This column shows the following:
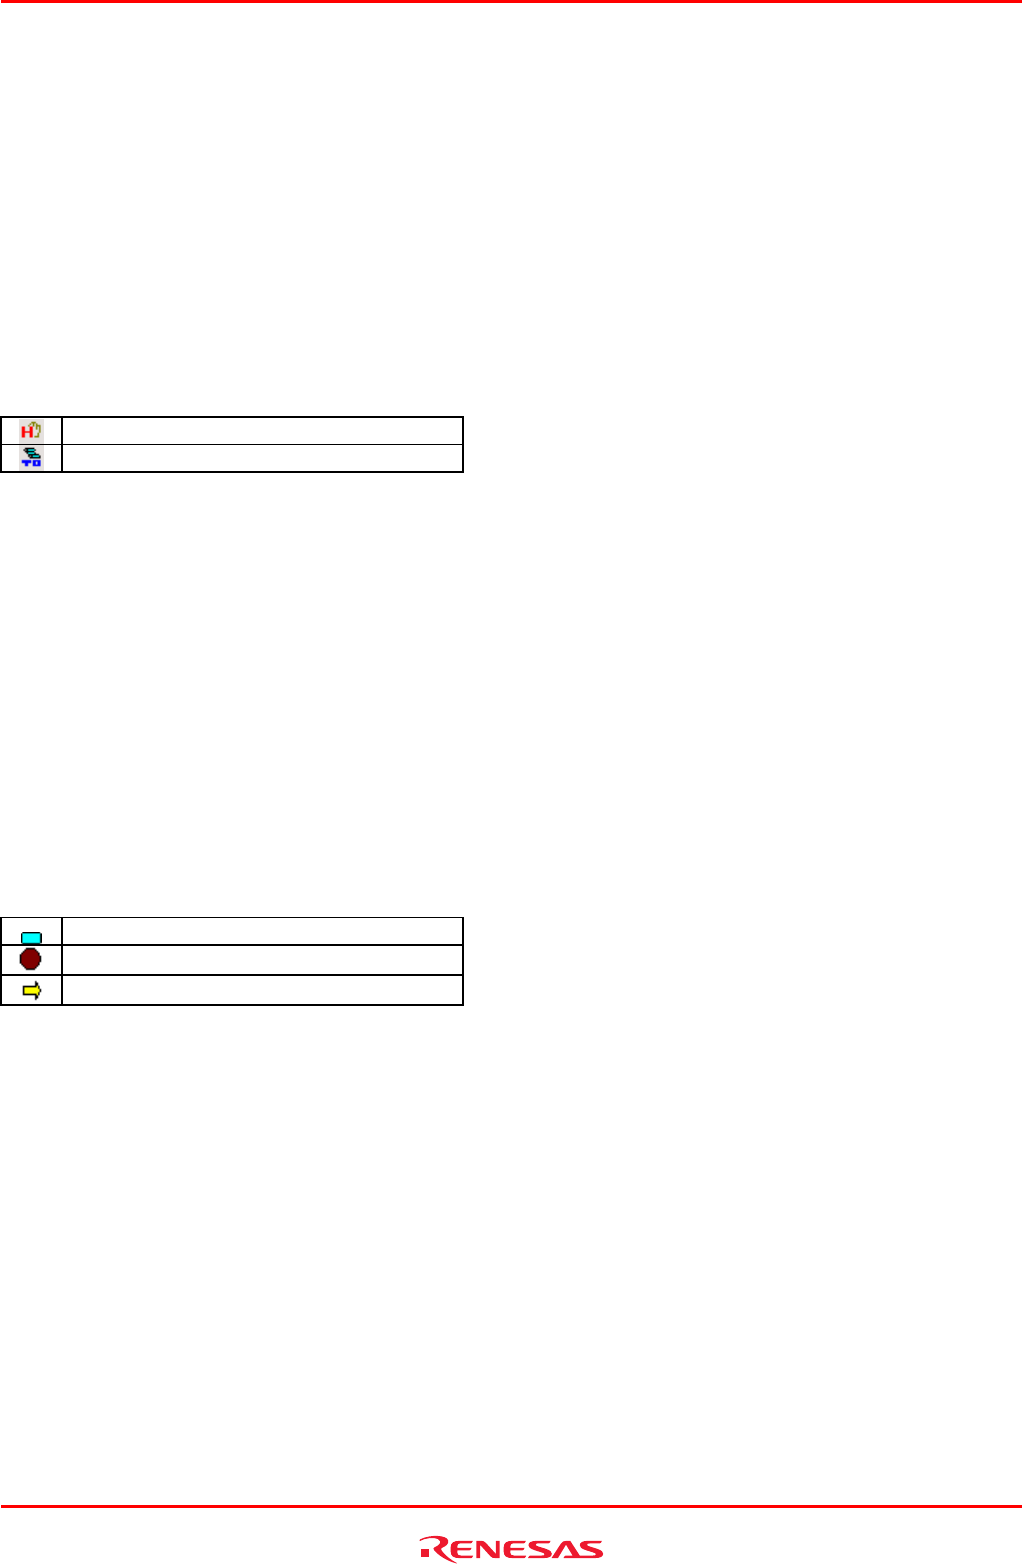
Table 5.2 Event column list
Hardware breakpoint is set
Trace point (fetch condition) is set
A hardware breakpoint can be inserted by double-clicking in the event column.
Trace points are displayed when fetch conditions are set.
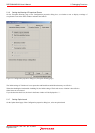
[*] after the title on the title bar of the dialog boxes of Hardware break, Trace conditions or Performance Analysis Conditions
shows that some setting is under editing. If you are doing some editing work, you cannot set change the settings from the event
column of the Editor window.
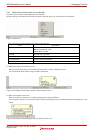
(4) Code Coverage column
Shows C0 code coverage information graphically.
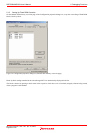
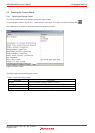
(5) S/W Breakpoints column
This column shows the following:
Table 5.3 Software breakpoint column list
Bookmark is set
Software break is set
PC position