


R0E530640MCU00 User’s Manual 5. Debugging Functions
REJ10J1733-0100 Rev.1.00 Apr. 01, 2008
Page 187 of 229
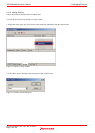
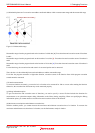
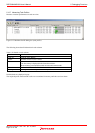
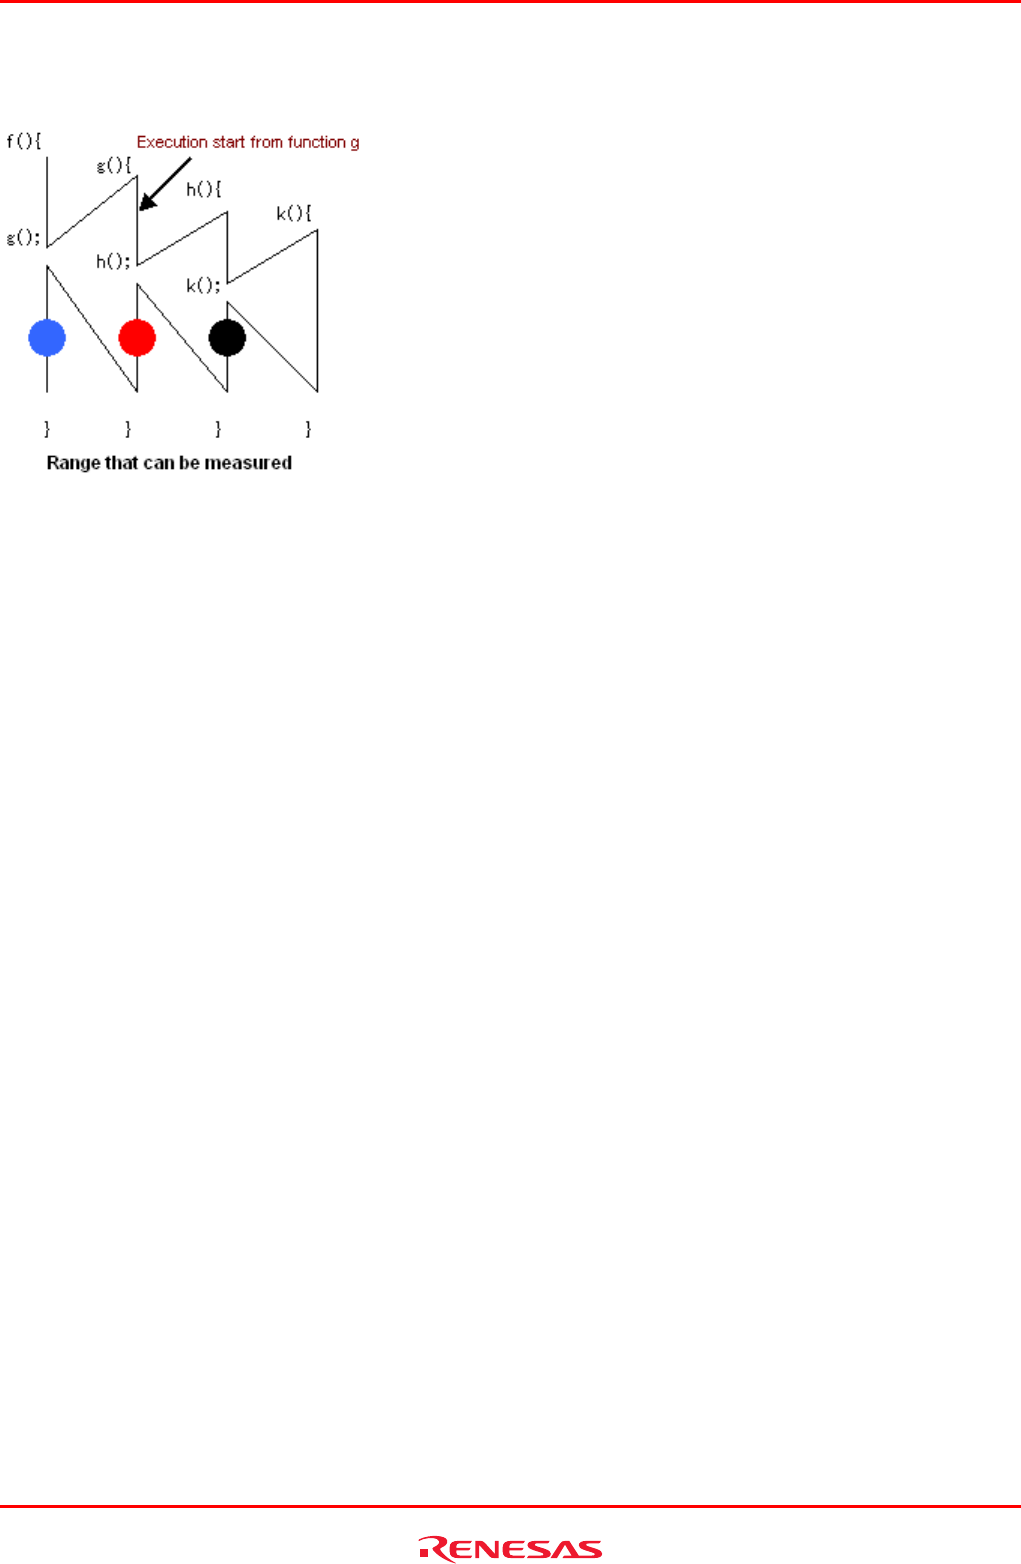
(e) Relationship between Go execution start address and break address within a measurement range and the measurable range
Figure 5.129 Measurable range
Measurable range when the program breaks at the location of a black dot [●]: Execution time and execution count of functions
h and k
Measurable range when the program breaks at the location of a red dot [●]: Execution time and execution count of functions h
and k
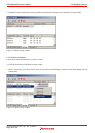
Measurable range when the program breaks at the location of a blue dot [●]: Execution time and execution count of functions h
and k
For the function g, the execution time and count in its executed portion can be measured.
Thus, the above is the relationship between break addresses and the measurable range.
Even after the program returned to a high-order function, execution counts of the function from which program execution
started cannot be measured.
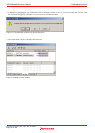
(f) Function measurement
To measure functions accurately, you need to be in a function to be measured for 100 ns or more after entering the function.
Otherwise, the execution time and count may not be measured properly.
(g) Debug information option
To get execution time and execution count of functions, you need to specify a source file that includes the functions for
measurement or an option that outputs debug information to the library during compiling. When not specifying the Debug
information option, you cannot measure execution time and execution counts of the function.
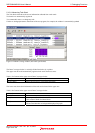
(h) Maximum execution time and minimum execution time
With the realtime profile, you cannot measure the maximum and minimum execution time of a function. To measure the
maximum and minimum execution time of a function, use the Performance Analysis window.