


R0E530640MCU00 User’s Manual 5. Debugging Functions
REJ10J1733-0100 Rev.1.00 Apr. 01, 2008
Page 140 of 229
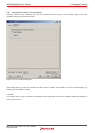
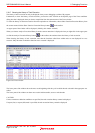
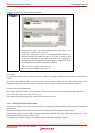
5.9.16 Showing the History of Function Execution
To show the history of function execution from the acquired trace information, choose Function Execution History -> Function
Execution History from the context menu or click the Function Execution History button
in the toolbar.
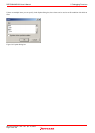
An upper pane of the window will be displayed. (Initially, this window is blank.)
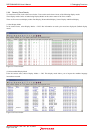
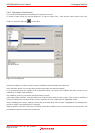
When you choose Analyze Execution History from the context menu or click the Analyze Execution History button
in
the toolbar, the emulator starts analyzing the execution history from the end of the trace result and shows the result in a tree
structure.
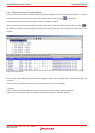
Figure 5.64 Trace window
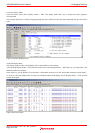
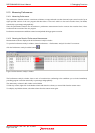
The lower pane of the window shows the trace result beginning with the cycle in which the function selected in the upper pane
was called.
The lower pane of the window can show trace results in disassemble, source or mixed mode.
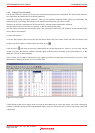
CAUTION
If trace extraction or deletion conditions are specified, the function execution history cannot be displayed.
If repeat (free) or repeat (full) mode is specified, the function execution history cannot be displayed.