


R0E530640MCU00 User’s Manual 5. Debugging Functions
REJ10J1733-0100 Rev.1.00 Apr. 01, 2008
Page 143 of 229
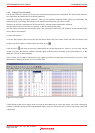
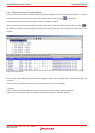
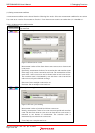
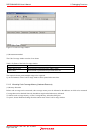
The contents displayed in this window are listed below.
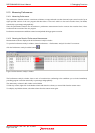
Table 5.23 Columns and contents
Column Description
No Numbers assigned to 1–8 measurement sections set in the Performance Analysis Conditions
dialog box.
Click Settings on the context menu to open the Performance Analysis Conditions dialog
box.
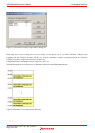
Condition
Indicated as
Enable when measurement conditions are set in the Performance Analysis
Conditions dialog box.
Otherwise, indicated as
Disable.
Run time
(h:m:s.ms.us.ns)
Cumulative execution time. It shows a cumulative time of measured execution time.
Count Shows the number of times measured.
Statistic Shows a ratio of cumulative execution time relative to Go–Break execution time.
[Ratio calculation formula]
(Cumulative execution time / Go–Break cumulative execution time) * 100
Max (h:m:s.ms.us.ns) Maximum execution time per measurement performed
Min (h:m:s.ms.us.ns) Minimum execution time per measurement performed
Average (h:m:s.ms.us.ns) Average execution time per measurement performed
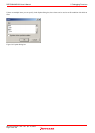
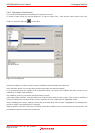
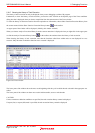
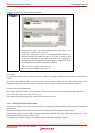
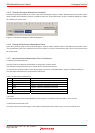
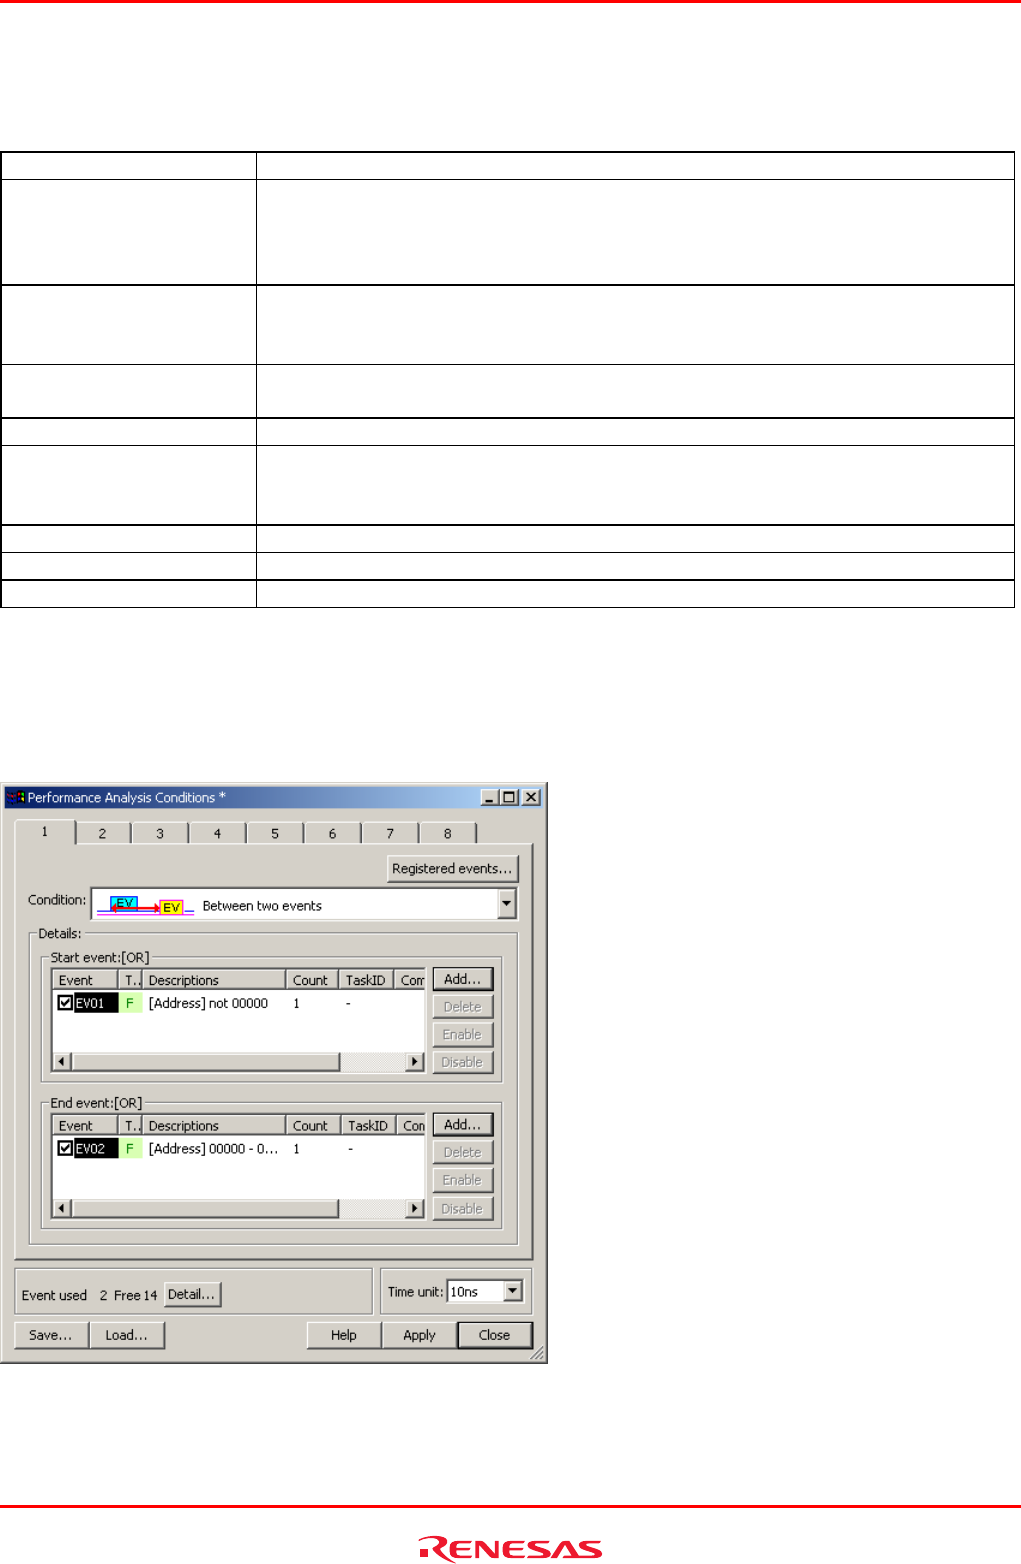
5.10.3 Setting Performance Measurement Conditions
In the Performance window, select a line of the section No. in which you want to set conditions and choose Set from the
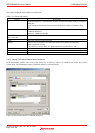
context menu. The Performance Analysis Conditions dialog box will be displayed.
Figure 5.67 Performance Analysis Conditions dialog box