


R0E530640MCU00 User’s Manual 5. Debugging Functions
REJ10J1733-0100 Rev.1.00 Apr. 01, 2008
Page 122 of 229
TID
Task ID (when RTOS is used).
Example display: A task ID (task entry label) is displayed like 1 (_Task1).
To show Task ID column, you need to select the Task ID on the Option page of the Trace
conditions dialog box displayed from the menu of the Trace window.
EXT Shows the signal fed in from the external trigger cable, indicated as “1” when the signal is high or “0”
when the signal is low.
To show EXT column, you need to select the External trigger on the Option page of the Trace
conditions dialog box displayed from the menu of the Trace window.
TimeStamp Shows an elapsed time since the target program started.
Each time the user program starts running, the time stamp starts counting from 0.
[CAUTION] When the counter overflows, the time is not displayed correctly.
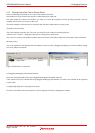
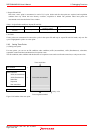
The unnecessary columns in the Trace window can be hidden. To hide a column, right-click in the header column and select
the column you want to hide from the context menu.
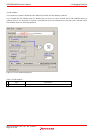
5.9.3 Setting Trace Information Acquisition Conditions
The trace buffer is limited in size, so that when the buffer is filled, the old trace data is overwritten with new data sequentially
beginning with the oldest.
Setting trace information acquisition conditions, you can acquire only the useful trace information, making effective use of the
trace buffer.
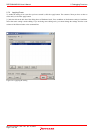
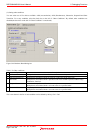
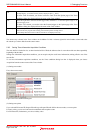
To set trace information acquisition conditions, use the Trace conditions dialog box that is displayed when you choose
Acquisition from the context menu of the Trace window.
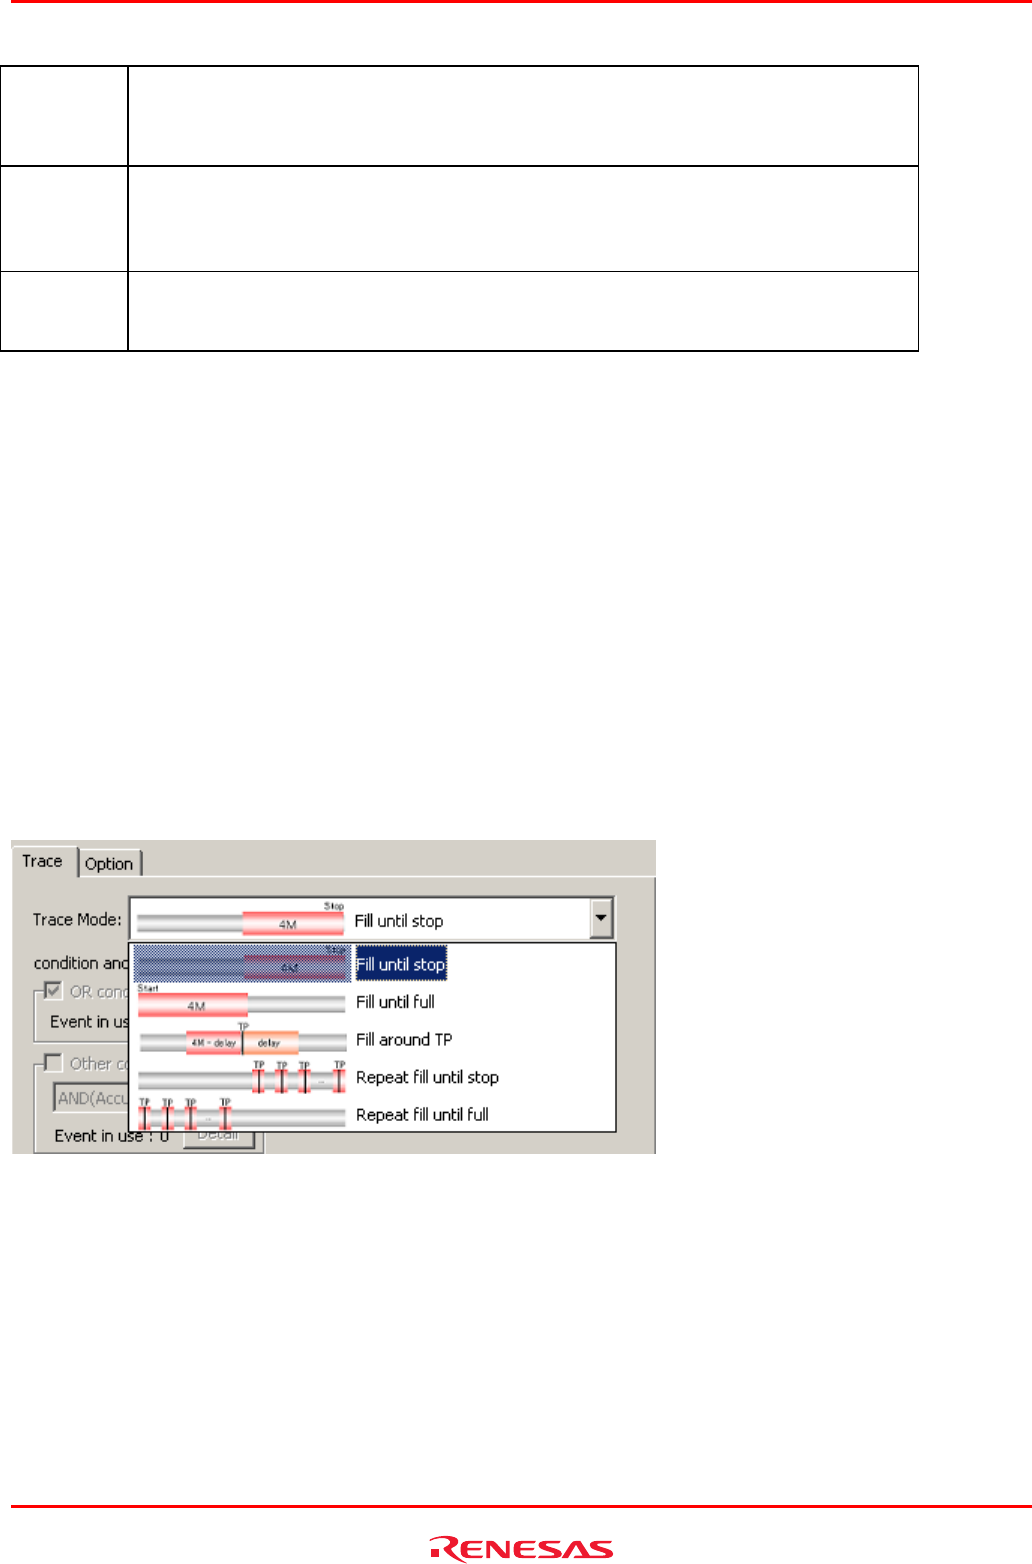
(1)
Setting trace modes
First, select a trace mode.
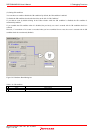
Figure 5.46 Trace conditions dialog box
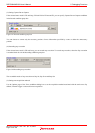
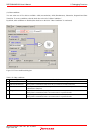
(2)
Setting trace points
If you selected Fill around TP, Repeat fill until stop or Repeat fill until full for the trace mode, set a trace point.
For trace points, you can set event based on conditions and exception events.
For Fill around TP, furthermore, you can set a delay value.