


R0E530640MCU00 User’s Manual 5. Debugging Functions
REJ10J1733-0100 Rev.1.00 Apr. 01, 2008
Page 191 of 229
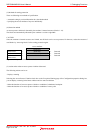
5.13.7 Measuring Task Profiles
Measure execution performance one task at a time.
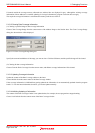
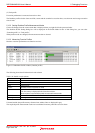
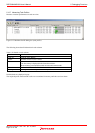
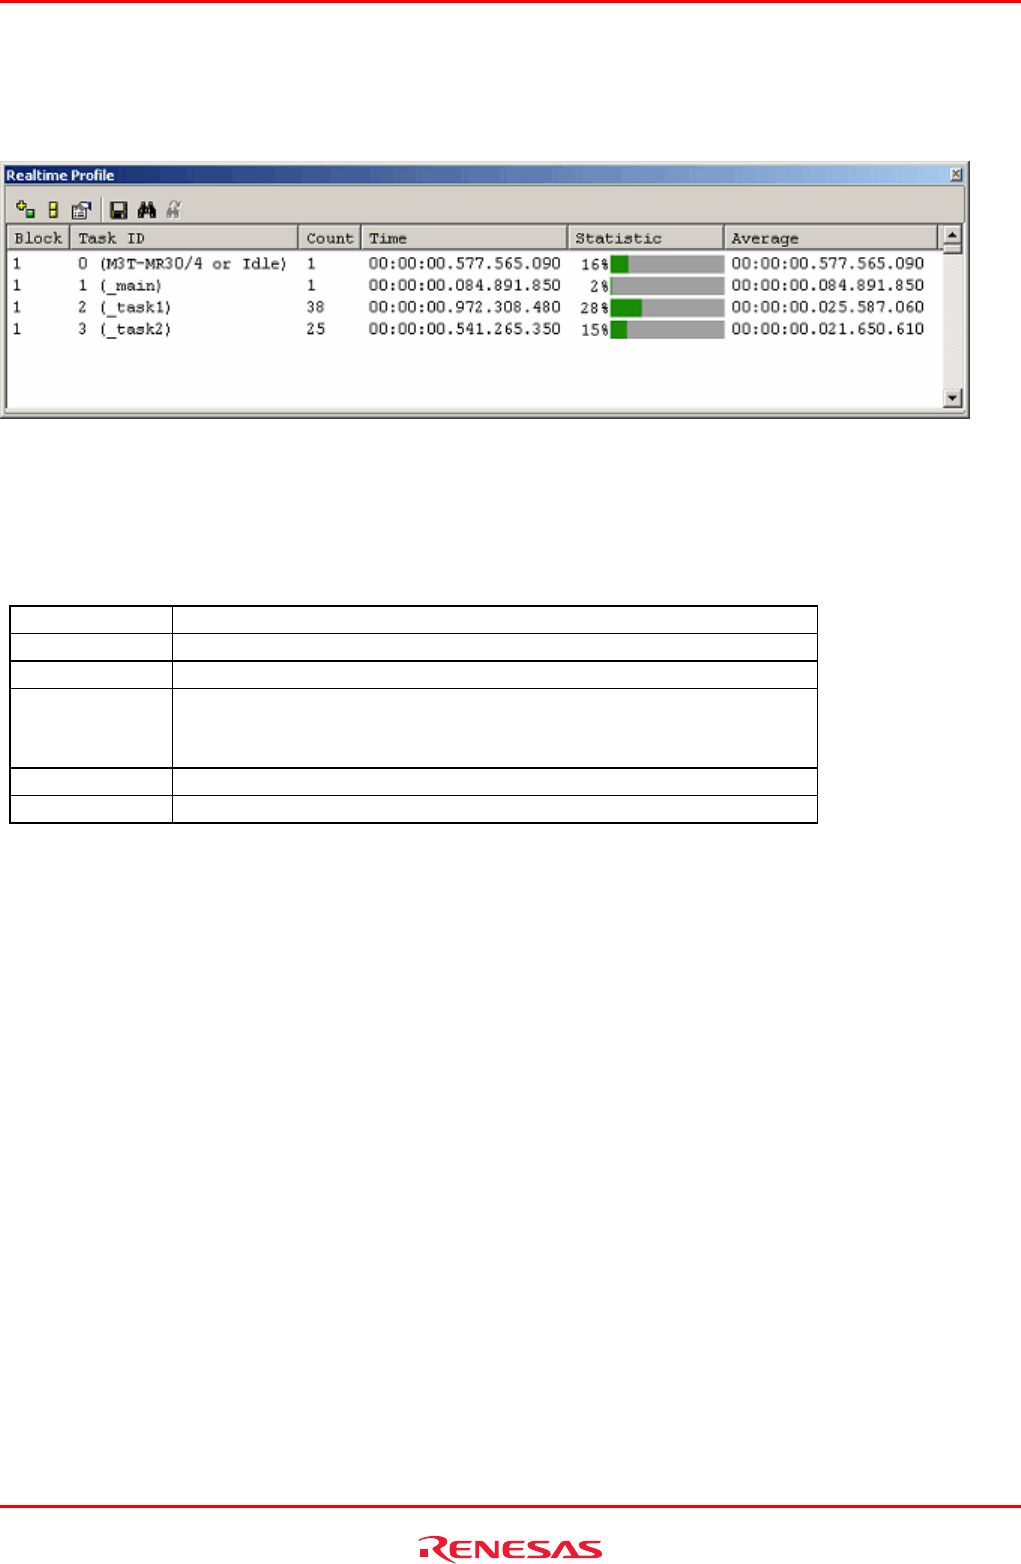
Figure 5.133 Realtime Profile dialog box (task profile):
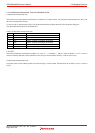
The following shows detail information in each column.
Table 5.42 Details on each column
Block Block number
Task ID Task ID, entry address
Count Number of times a task is called
Time Cumulative time of task execution
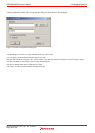
The time stamp is displayed in the form shown below.
Hours:minutes:seconds.milliseconds.microseconds.nanoseconds
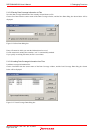
Statistic
Ratio of task
Time to Go-Break execution time
Average Average execution time per measurement performed
Disabled tasks are displayed in gray.
The acquired profile measurement results are accumulated in memory until the user clears them.