


R0E530640MCU00 User’s Manual 5. Debugging Functions
REJ10J1733-0100 Rev.1.00 Apr. 01, 2008
Page 186 of 229
5.13 Viewing Realtime Profile Information
5.13.1 Viewing Realtime Profile Information
The E100 emulator has its code coverage, data coverage and realtime profile functions usable exclusively to each other.
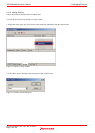
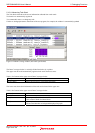
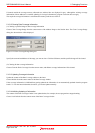
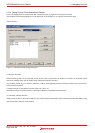
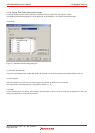
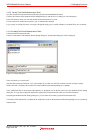
To use the realtime profile function, choose Realtime Profile in the Switching function section on the System page of the
Configuration properties dialog box.
Realtime profile is the function to measure execution performance within an area allocated to addresses in the profile range,
one function or one task at a time. It will help you find the locations and causes of performance degradation in an application
program.
Measurements are carried out without obstructing user program execution.
The measurement results are updated when the program breaks.
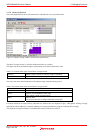
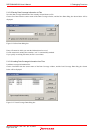
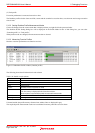
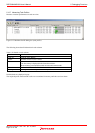
(1) Function profile
Execution performance is measured one function at a time.
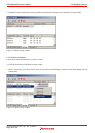
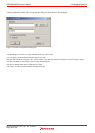
The Realtime profile window shows function names, the start addresses of functions, function sizes, counts and the cumulative
execution time, execution rate and average execution time of functions.
The function profile of the E100 emulator does not include the execution time of subroutines in its cumulative display of
function execution time.
CAUTION
The function profile is subject to the following limitations:
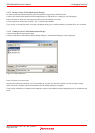
(a) About the areas to be measured
The E100 emulator can acquire profile information on all functions in areas up to 8 blocks, each in 128 KB units.
Each block you set can be comprised of a contiguous or noncontiguous address area.
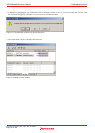
No functions can be set that are outside the range of block addresses. In that case, the functions or tasks are displayed in gray.
(b) Limit to the number of functions
Measurement can be taken of up to 8K – 1 (= 8,191) functions.
If the number of functions measured exceeds 8K – 1 (= 8,191), the extra functions are excluded from the subject of
measurement. In that case, those functions are displayed in gray. (Function names, address and function sizes are displayed in
gray.)
(c) In-line expansion
The functions that are expanded in-line for optimization by the compiler are not displayed in the Realtime Profile window.
(d) Recursive functions
Although the execution time of recursive functions can be measured correctly, they are executed only once.