R0E530640MCU00 User’s Manual 5. Debugging Functions
REJ10J1733-0100 Rev.1.00 Apr. 01, 2008
Page 92 of 229
5.2.5 Showing Assembly Language Code
While a source file is open, click the right mouse button in the Editor window and choose View Disassembly from the context
menu. The Disassembly window will be displayed.
The display start address in the Disassembly window is the one that corresponds to the cursor position in the Editor window.
You also can use the Disassembly View button in the Editor window to display disassembled codes.
If no source files exist, one of the following methods may be used to display disassembled codes.
− Click the Disassembly toolbar button [
].
− Choose Disassembly from the View menu.
− Use the “Ctrl + D” accelerator.
In this case, the Disassembly window opens at the current PC position.
Mixed mode display where all source lines are displayed beginning with that address is also supported as an option. To display
disassembled codes in mixed mode, click the Show in Mixed Mode button.
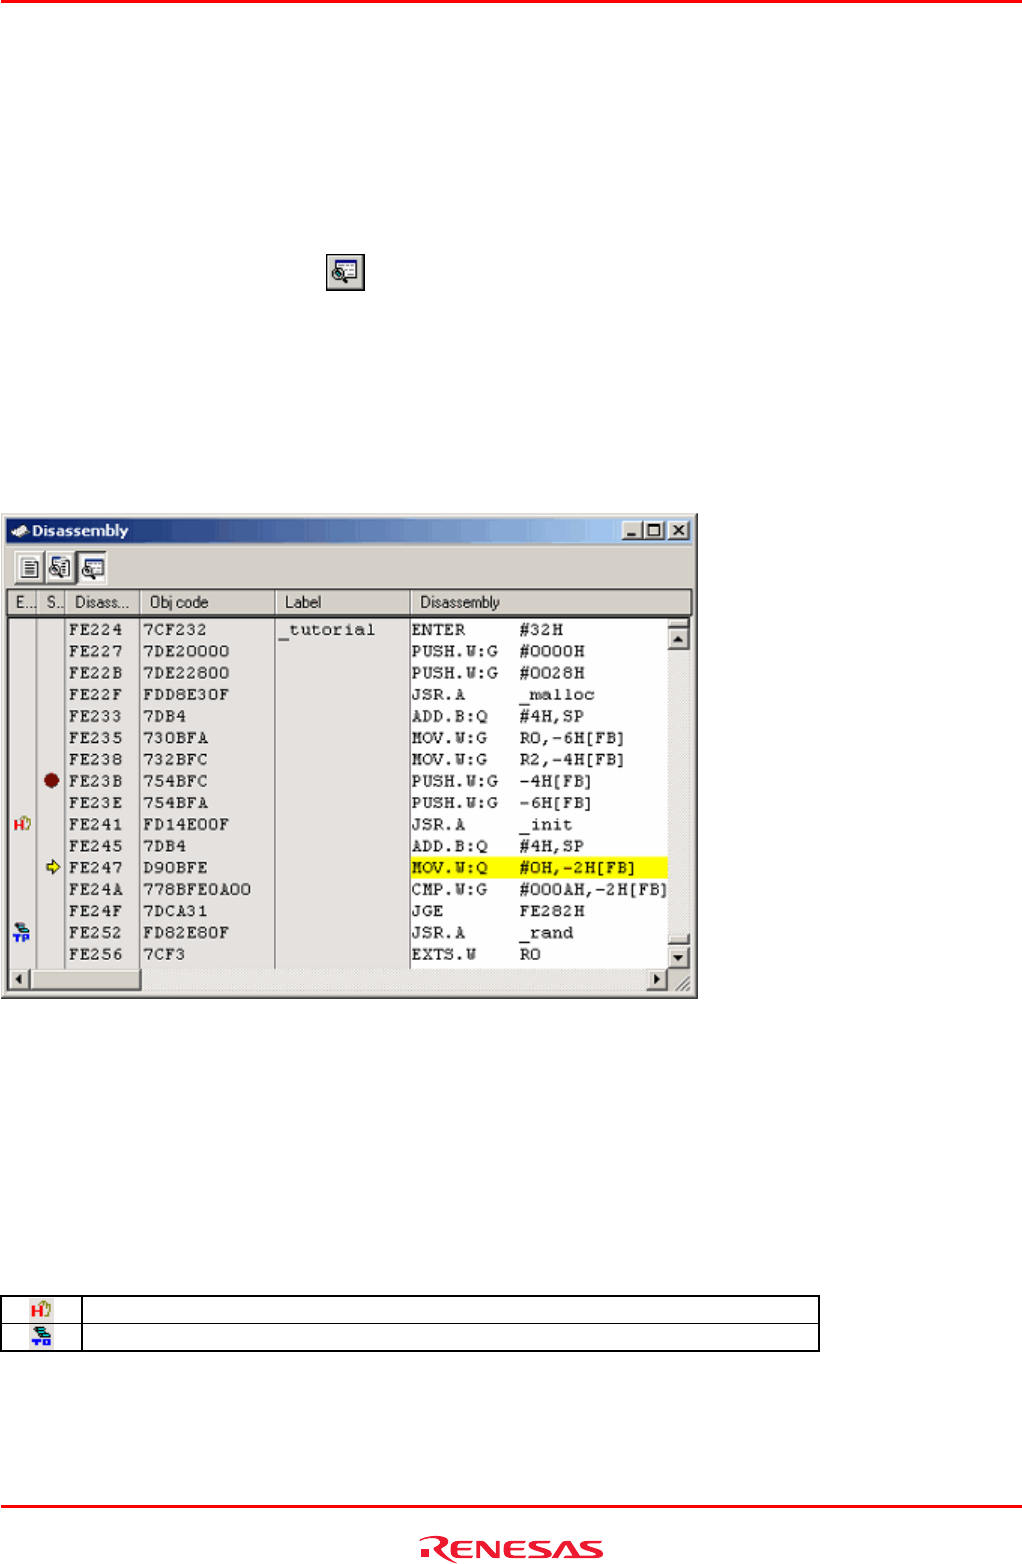
Figure 5.10 Disassembly window
Shown at left edge of this window are the line information consisting of the following:
(1) Event column
This column shows the following:
Table 5.4 Event column list
Hardware breakpoint is set.
Trace point (fetch condition) is set.
A hardware breakpoint can be inserted by double-clicking in the event column.
Trace points are displayed when fetch conditions are set.


