


R0E530640MCU00 User’s Manual 5. Debugging Functions
REJ10J1733-0100 Rev.1.00 Apr. 01, 2008
Page 188 of 229
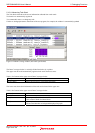
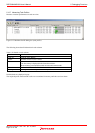
(2) Task profile
Execution performance is measured one task at a time.
The Realtime profile window shows task IDs, counts and the cumulative execution time, execution rate and average execution
time of tasks.
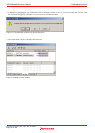
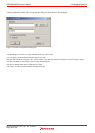
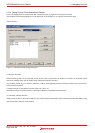
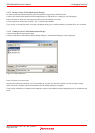
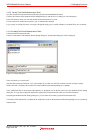
5.13.2 Setting Realtime Profile Measurement Modes
Choose Set Ranges from the context menu that is displayed when you right-click in the present window.
The Realtime Profile Setting dialog box will be displayed. In the Profile Mode list box of this dialog box, you can select
“Function profile” or “Task profile.”
When profile modes are changed, all measurement results are cleared.
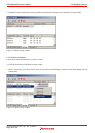
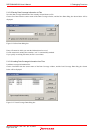
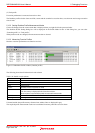
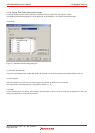
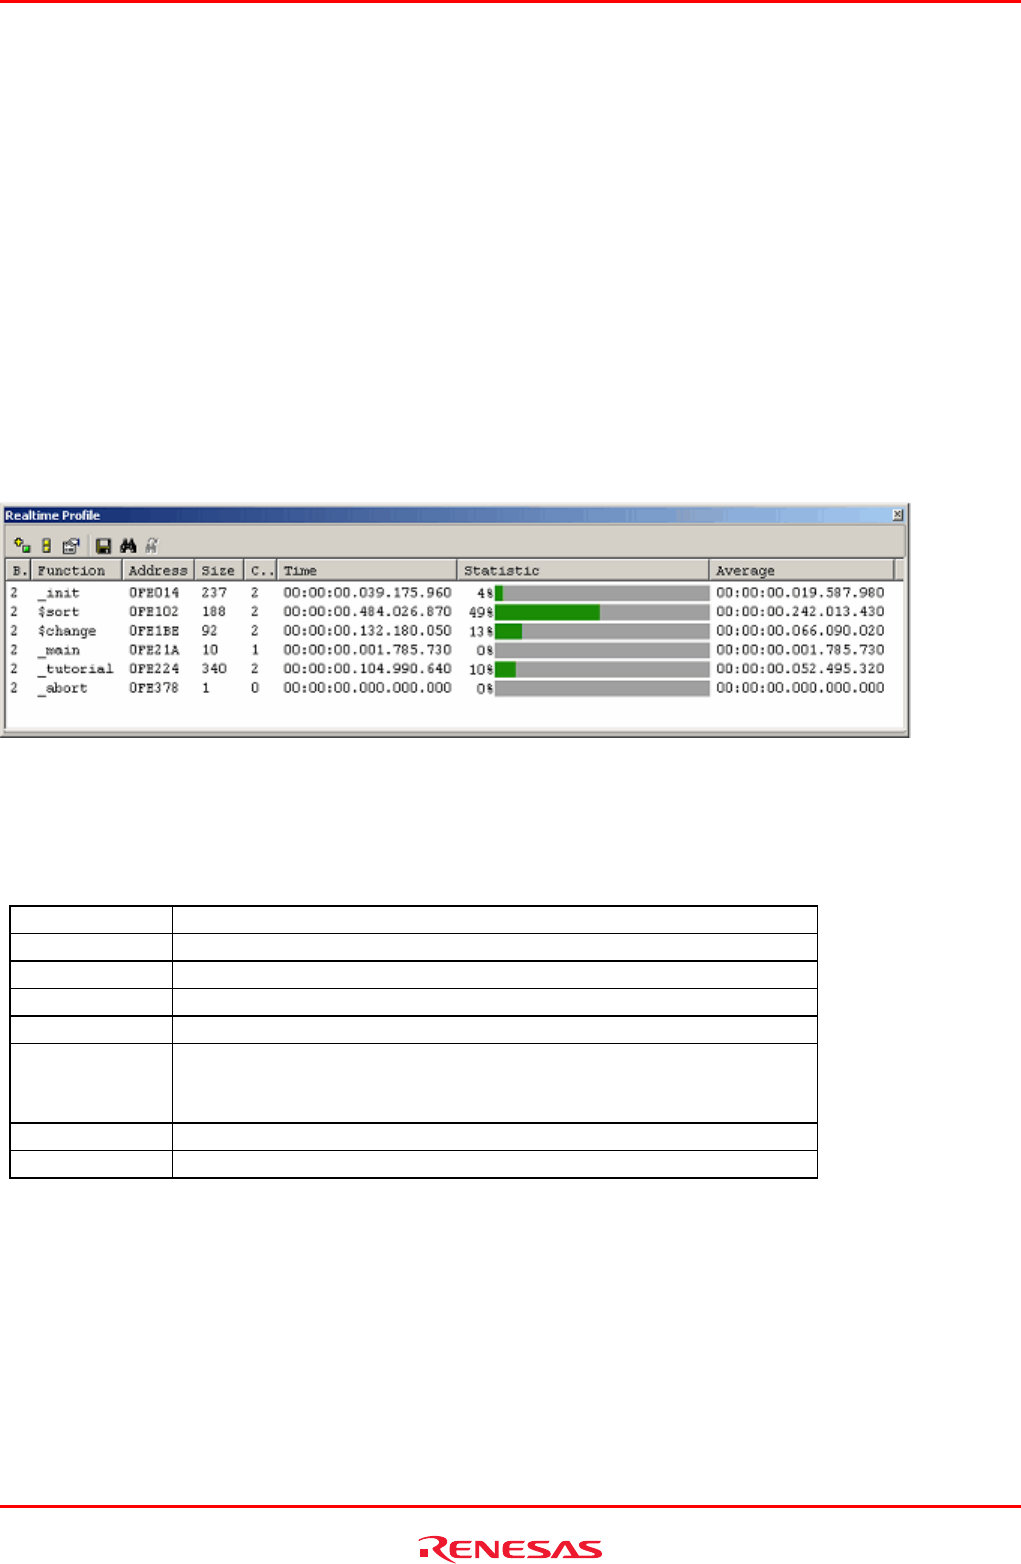
5.13.3 Measuring Function Profiles
Measure execution performance one function at a time.
Figure 5.130 Realtime Profile window (function profile)
The following shows detail information in each column.
Table 5.41 Details on each column
Block Block number
Function Function name
Address Start address of function
Size Function size
Count Number of times a function is called
Time Cumulative time of function execution
The time stamp is displayed in the form shown below.
Hours:minutes:seconds.milliseconds.microseconds.nanoseconds
Statistic Ratio of function Time to Go-Break execution time
Average Average execution time per measurement performed
If located outside the profile memory allocated area, address lines are displayed in gray.
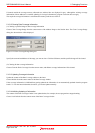
The acquired profile measurement results are accumulated in memory until the user clears them.