


126 | Dell SonicWALL WXA 1.3 User’s Guide
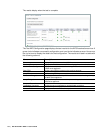
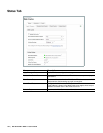
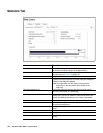
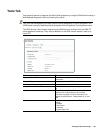
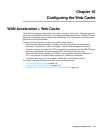
Statistics Tab
Name Description
Covering Period Drop-Down Menu Click the Covering Period drop-down menu and select the
period of time the data displays on the Statistics tab.
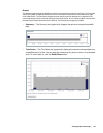
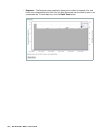
Chart: Drop-Down Menu Selects what data displays in the graph. For details on the differ-
ent chart types, see Graphs on page 127.
Refresh Button Refreshes the Web Cache > Statistics tab.
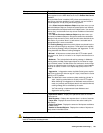
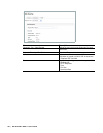
Data Since
Displays the actual period covered using the statistics
shown in the data and graphs.
Note: This might differ from the chosen covering period,
depending on the data stored and available on the
appliance.
Total Data Reduction (%) Displays the difference between the data conveyed and the
data sent, represented as a percentage.
WAN Capacity Increase Factor Displays the ratio of the amount of data conveyed to the amount
actually sent. This can be used as a guide to how much extra
capacity the WAN gained without any increase in bandwidth.
Requests The number of requests made during the selected period.
Hits The number of requests that were served from the Web Cache
during the selected period.
Errors The total number of errors encountered during the selected
period.
Cache Size Displays the current size of the cache used by the Web Cache.
Cache Free Space Displays the amount of disk space available to the Web Cache.
Number of Cached Objects Displays the number of objects currently stored in the Web
Cache.