


Viewing the Web Cache Page | 127
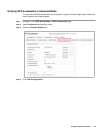
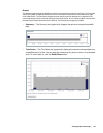
Graphs
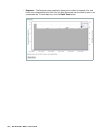
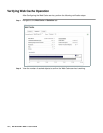
The Statistics graphs display the Web Cache data for the selected Covering Period and Chart. The Conveyed
data is the number of bytes that would be sent from a web server without the use of the WXA series appli-
ance’s Web Cache. The Sent data is the bytes that are actually sent from web servers in response to the
user’s web request, with the remainder being served from the cache. A “Hit” is when an object is served from
the Web Cache instead of fetched from the internet. The following Chart types are available:
•
Summary— The Summary chart graphically displays the sent and conveyed bandwidth
data.
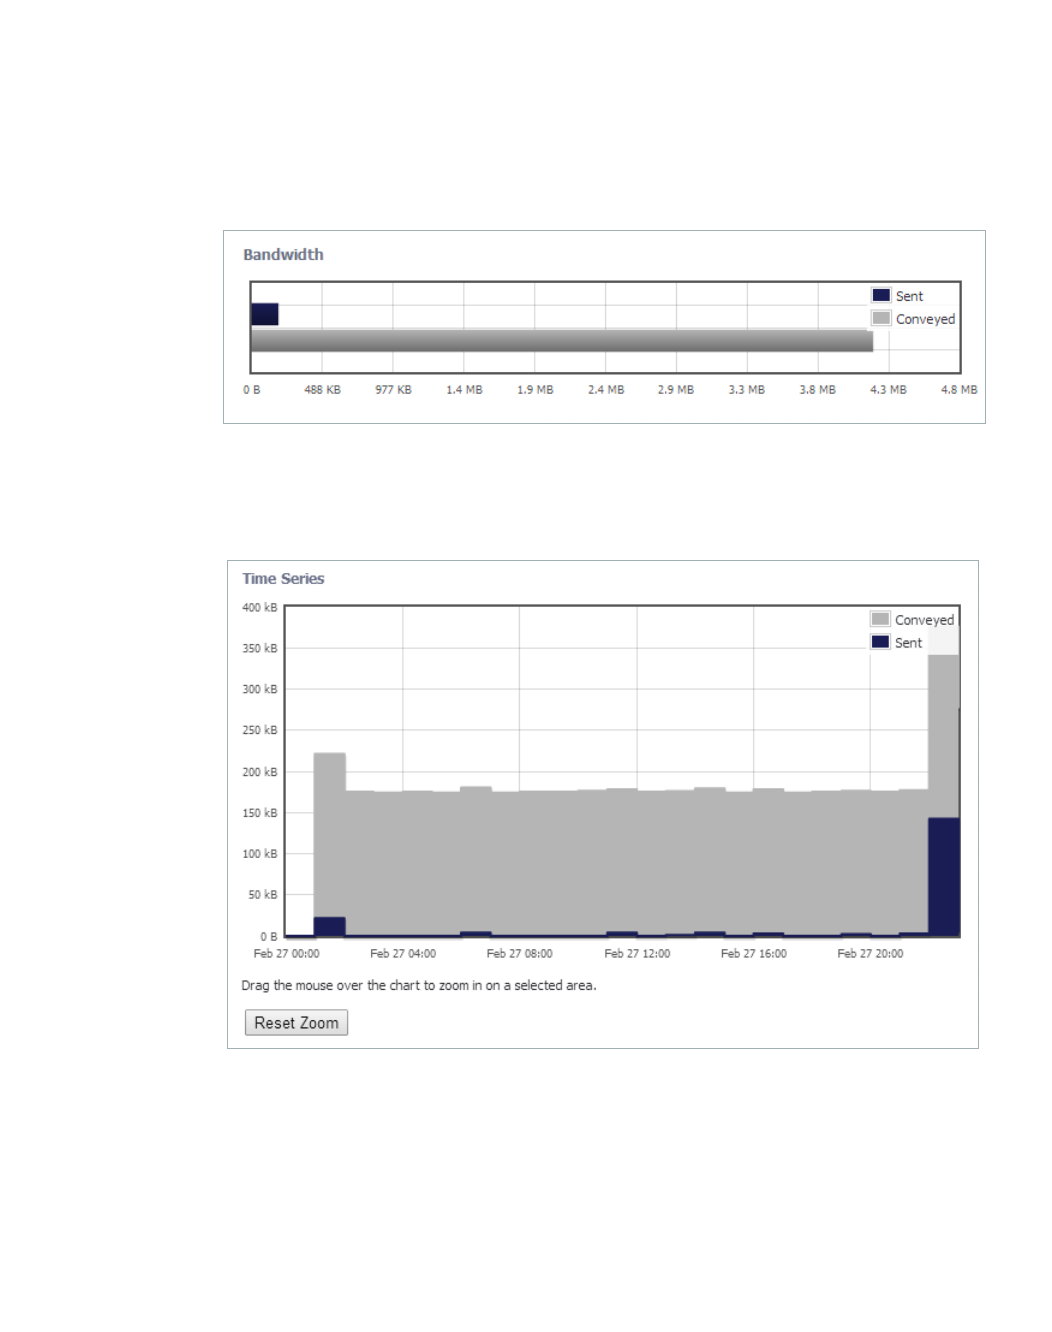
• Time Series— The Time Series chart graphically displays the sent and conveyed data over
a specified period of time. You can drag the mouse over the chart to zoom in on a selected
area. To zoom back out, click the Reset Zoom button.