


Reports Configuring reports
FortiAnalyzer Version 3.0 MR7 Administration Guide
05-30007-0082-20080908 113
Reports
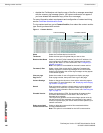
FortiAnalyzer units can collate information collected from device log files and
present the information in tabular and graphical reports, which provides quick
analysis of what is occurring on the network.
By using reports, you can:
• minimize the effort required to identify attack patterns when customizing
policies to prevent attacks
• monitor Internet surfing patterns for compliance with company policy
• identify your web site visitors for potential customers
FortiAnalyzer reports are also flexible, offering administrators a choice to compile
a report layout based on variables (which can be reused) or based on specific
information. Fortinet recommends a report layout based on variables and then
reuse them.
This section includes the following topics:
• Configuring reports
• Browsing reports
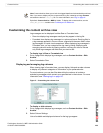
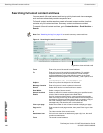
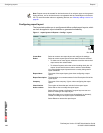
Configuring reports
Logs must be collected or uploaded before you can generate a report. Logs are
the basis of all FortiAnalyzer reports. After logs are collected or uploaded, you can
then define the three basic components that make up a report:
• report layout (the layout and the contents)
• output and data filter templates, language (optional components)
• report schedule (log data parameters and time range)
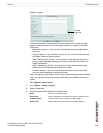
You need to configure a report layout first, before configuring the report schedule
because the report schedule requires a report layout. These output destination
and data filter configurations are referred to as templates because they can be
applied to any report layout or report schedule that you want.
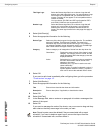
If you are using data filter or output templates with a report schedule, these
templates cannot be deleted. Data filter or output templates can be deleted when
they are not being used by a report schedule.
When configuring a report layout, you can create individual charts that contain
variables or specific log information, or both. You can configure multiple variable
and specific charts within the report layout. The charts containing variables will
always provide different information because they are not specific. The charts
containing the specified information stay the same unless edited. Variable charts
override specific charts.