System Dashboard
FortiAnalyzer Version 3.0 MR7 Administration Guide
05-30007-0082-20080908 37
Log Receive Monitor
The Log Receive Monitor displays historical analysis of the rate at which logs are
received. This widget displays this information in a graphical format.
You can display information by the type of logs or by device and you can also
specify the time period. A new diagnose command was also added to display
this information in the CLI.
You can edit the Log Receive Monitor to display specific information. The
following procedure describes how to edit the Log Receive Monitor widget.
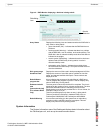
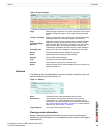
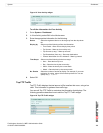
Figure 13: Log Receive Monitor widget
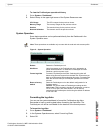
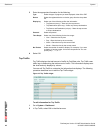
To edit information for Log Receive Monitor
1 Go to System > Dashboard.
2 On the Log Receive Monitor, select Edit in the title bar area.
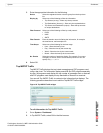
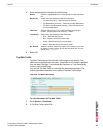
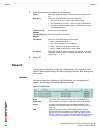
3 Enter the appropriate information for the following:
4 Select OK.
Type Select either Log Type or Device.
If you choose Log Type, the monitor displays the type of logs that
are received from all registered devices and separates them into
categories, for example top 5 traffic logs, antivirus logs.
If you choose Device, the monitor displays the logs that received
by each registered device and separates the devices into the top
number of devices.
Top N Select one number from the drop-down list to display the top log
types. If you select only one number from the drop-down list, only
the top log type will display, for example, the traffic log.
Period The time range for monitoring the logs received. You can select
one of the following:
• Hour – monitors the rate at which logs are received within a
period of one hour
• Day – monitors the rate at which logs are received within a
period of one day
• Week – monitors the rate at which logs are received within a
period of one week
Automatically
Refresh
Select the check box if you want to have the monitor automatically
refresh the information.


