


System Dashboard
FortiAnalyzer Version 3.0 MR7 Administration Guide
05-30007-0082-20080908 43
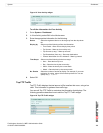
3 Enter the appropriate information for the following:
4 Select OK.
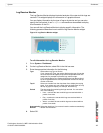
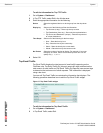
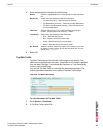
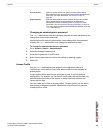
Top Web Traffic
Top Web Traffic displays the total web traffic usage on the network. This
information is displayed as a bart chart. Information for this widget is gathered
from the Web Filter logs, if you selected By Requests, or, if you selected By
Volume, from the traffic logs.
You can edit Top Web Traffic to customize the information displayed. The
following procedure describes how to edit the Top Web Traffic widget.
Figure 20: Top Web Traffic widget
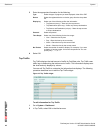
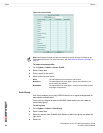
To edit information for Top Web Traffic
1 Go to System > Dashboard.
2 In Top Web Traffic, select Edit.
Device Select the registered device or device group from the drop-down
list.
Display by Select one of the following to filter the information:
• Top Sources (to any) – filters only the top sources
• Top Destinations (from any) – filters only the top destinations
• Top Source and Destination (unique) – filters the top sources
to unique destinations
Filter Port Select the type of port, TCP or UDP, and then enter the port
number. The port number can be from 1 - 65535.
Time Scope Select one of the following for the time range:
• Hour – filters the time by hour
• Day – filters the time by the current day
• Week – filters the time by the current week
• Month – filters the time by the current month
No. Entries Select the number of entries to display. For example, if you want
to display 10 entries, select 10 from the drop-down list. You can
specify only 5, 10, or 20.