


Appendix: FortiAnalyzer reports in 3.0 MR7 FortiGate reports
FortiAnalyzer Version 3.0 MR7 Administration Guide
005-30007-0082-20080908 195
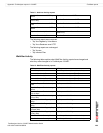
The following reports are unchanged:
• Traffic Volume by Direction
• Top Denied Policies
• Top Denied Services
• Top Denied Sources
• Top Denied Destinations
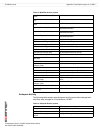
Web Activity
The following table explains what Web Activity reports have changed and what
they were changed to in FortiAnalyzer 3.0 MR7. This table also includes the
category that the reports were moved to, if applicable.
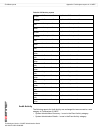
Top Traffic Volumes by Service Top Services by Volume
Traffic Volume of each Device by
Date
Traffic Volume by Direction
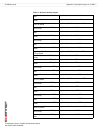
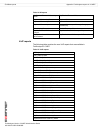
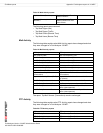
Table 17: Network Activity reports
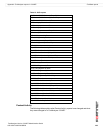
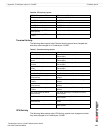
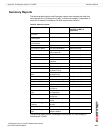
Table 18: Web Activity reports
MR6 reports MR7 reports Category that reports
were moved to in
MR7 (if applicable)
Web Traffic by Date Web Volume by Time Period
Web Traffic by Month Web Volume by Time Period
Web Traffic by Day of Week Web Volume by Time Period
Web Traffic by Hour of Day Web Volume by Time Period
Web Traffic by Direction Web Volume per Traffic
Direction
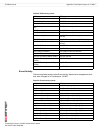
Top Web Sites (Connections) Top Web Servers by
Connections
Top Web Sites (Traffic) Top Web Servers by Volume
Top Web Sites (Traffic+Hits) Top Web Servers by Volume
and Hits
Top Web Pages by Client (Hits) Top Users for Most
Requested Web Pages
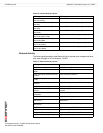
Web Filter Activity
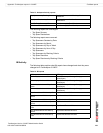
Top Web Clients (Connections) Top Web Clients by
Connections
Top Web Clients (Traffic) Top Web Clients by Volume
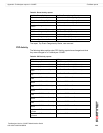
Top Web Clients by Web Site
(Connections)
Top Web Servers by
Connections for most Active
Clients
Top Web Clients by Web Site
(Traffic)
Top Web Servers by Volume
for most Active Clients
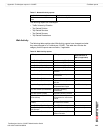
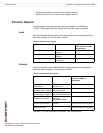
Web Traffic by Top Web Servers Top HTTP Servers by Volume Content Activity
Web Traffic by Status and Top
Web Servers
Top HTTP Servers by Volume Content Activity
Top Web Sites (Duration) Top Web Servers by Firewall
Session Duration