


Network Analyzer Viewing Network Analyzer log messages
FortiAnalyzer Version 3.0 MR7 Administration Guide
05-30007-0082-20080908 143
Viewing Network Analyzer log messages
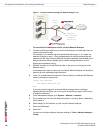
After attaching a FortiAnalyzer unit interface to the network and enabled the
Network Analyzer for that interface, traffic information displays.
The Network Analyzer’s log viewers display logs of traffic seen by the network
interface you have configured for use with Network Analyzer, focusing on specific
time frames.
The Network Analyzer has two types of log viewing options:
• Real-time displays the Network Analyzer log messages of traffic most recently
observed by the network interface for which Network Analyzer is enabled. The
display refreshes every few seconds, and contains only the most current
activity.
• Historical displays all Network Analyzer log messages whose time stamps are
within your specified time frame.
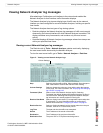
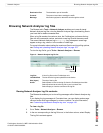
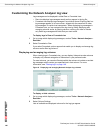
Viewing current Network Analyzer log messages
The Real-time tab in Tools > Network Analyzer updates continually, displaying
the most recent traffic observed by the Network Analyzer.
To view the most recent traffic, go to Tools > Network Analyzer > Real-time.
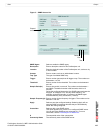
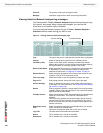
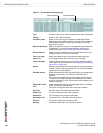
Figure 2: Viewing current Network Analyzer logs
Stop Select to stop the traffic sniffing. When selected, Stop changes to
Start. Select Start to continue the real-time traffic viewing.
Column Settings Select to change the columns to view and the order they appear
on the page. For more information, see “Displaying and arranging
log columns” on page 148.
Formatted | Raw Select a view of the Network Analyzer log file. Selecting
Formatted (the default) displays the Network Analyzer log files in
columnar format. Selecting Raw, displays the Network Analyzer
log information as it actually appears in the log file.
Resolve Host Name Select to display host names by a recognizable name rather than
IP addresses. For more information about on configuring IP
address host names see “Configuring IP aliases” on page 61.
Resolve Service Select to display the network service names rather than the port
numbers, such as HTTP rather than port 80.
Log Time The date and time the traffic was transmitted.
Source The IP address of the sender of the traffic.
Destination The IP address of the recipient of the traffic.
Destination Port The port a UDP or TCP packet was being sent to.
Column Settings