


FortiAnalyzer Version 3.0 MR7 Administration Guide
144 05-30007-0082-20080908
Viewing Network Analyzer log messages Network Analyzer
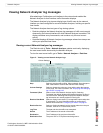
Viewing historical Network Analyzer log messages
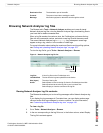
The Historical tab in Tools > Network Analyzer displays Network Analyzer logs
for a specific time range. When viewing log messages, you can filter the
information to find specific traffic information.
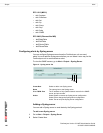
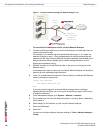
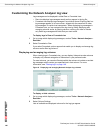
To view a historical Network Analyzer log, go to Tools > Network Analyzer >
Historical and then select the log you want to view.
Figure 3: Viewing historical Network Analyzer logs
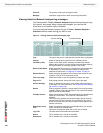
Protocol The protocol used when sending the traffic.
Message Information payload of the traffic sent through the switch.
Type The type of log you are viewing and the device where it originated.
Change Select to change the log, time frame or a different device.
Formatted | Raw Select a view of the log file. Selecting Formatted (the default)
displays the log files in columnar format. Selecting Raw, displays
the log information as it actually appears in the log file.
Resolve Host Name Select to display host names by a recognizable name rather than
IP addresses. For more information about on configuring IP
address host names see “Configuring IP aliases” on page 61.
Resolve Service Select to display the network service names rather than the port
numbers, such as HTTP rather than port 80.
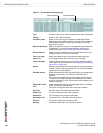
View n per page Select the number of rows of log entries to display per page.
Page n of n Enter a page number, then press Enter to go to the page.
Column Settings Select to change the columns to view and the order they appear
on the page. For more information, see “Displaying and arranging
log columns” on page 148.
Search Enter a keyword to perform a simple search on the log information
available. Select Go to begin the search. The number of matches
appears above the Search field.
Printable Version Select to download an HTML file containing all log messages that
match the current filters. The HTML file is formatted to be
printable.
Time required to generate and download large reports varies by
the total amount of log messages, the complexity of any search
criteria, the specificity of your column filters, and the speed of your
network connection.
Download Current
View
Select to download only those log messages which are currently
visible, according to enabled filters.
This button only appears when the current view is filtered.
Log Time The date and time the traffic was transmitted.
Source The IP address of the sender of the traffic.
Destination The IP address of the recipient of the traffic.
Column Settings Printable Version